 English
  Русский
 Bahasa Indonesia
 Bahasa Malay
 ไทย
ไทย Español
 Deutsch
 Български
 Français
 Tiếng Việt
 中文
中文 বাংলা
বাংলা हिन्दी
 Čeština
 Українська
 Română

Trend analysis (Fig. 1).
Today, from the level of 1.2143 (closing of yesterday's daily candlestick), the market will attempt to continue moving upward with the target of 1.2261 - the target level (blue dotted line). If this level is tested, it is possible to work downward with a target of 1.2164 – a pullback level of 14.6% (red dotted line).
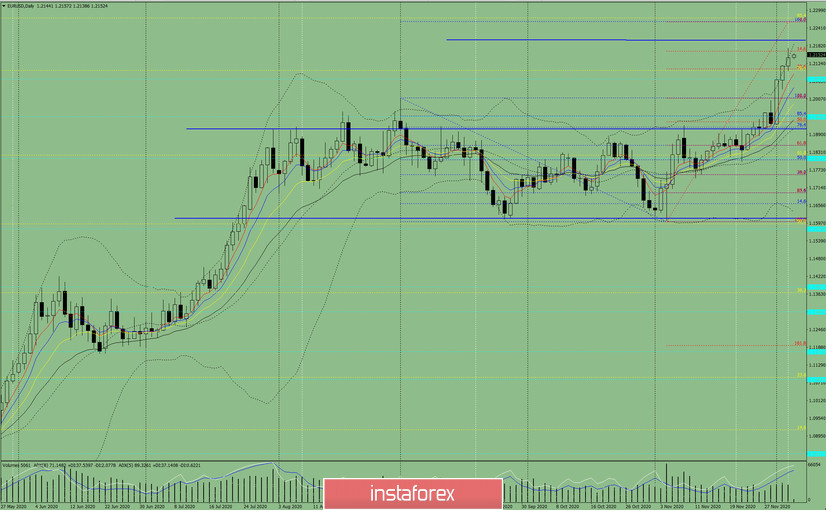
Figure 1 (Daily Chart).
Comprehensive analysis:
- Indicator analysis - up
- Fibonacci levels - up
- Volumes - up
- Candlestick analysis - down
- Trend analysis - up
- Bollinger bands - up
- Weekly chart - up
General conclusion:
Today, from the level of 1.2143 (closing of yesterday's daily candlestick), the price will try to continue moving upward with the target of 1.2261 – the target level of 161.8% (blue dotted line). If this level is tested, it is possible to work down with a target of 1.2164 – a pullback level of 14.6% (red dotted line).
Alternative scenario: when moving upward and testing 1.2261 - the target level of 161.8% (blue dotted line), it is possible to continue working upward with the final target of 1.2555 – the upper fractal (yellow dotted line), which is the daily candlestick from 16/02/2018.