 English
  Русский
 Bahasa Indonesia
 Bahasa Malay
 ไทย
ไทย Español
 Deutsch
 Български
 Français
 Tiếng Việt
 中文
中文 বাংলা
বাংলা हिन्दी
 Čeština
 Українська
 Română

Trend Analysis (Fig. 1).
Today, the market will try to continue going up from the level of 1.3445 (closing of yesterday's daily candle) with the target of 1.3482 at the resistance line (red bold line). When this line is reached, the price will continue to go up with the target of 1.3753 at the old resistance line (blue bold line).
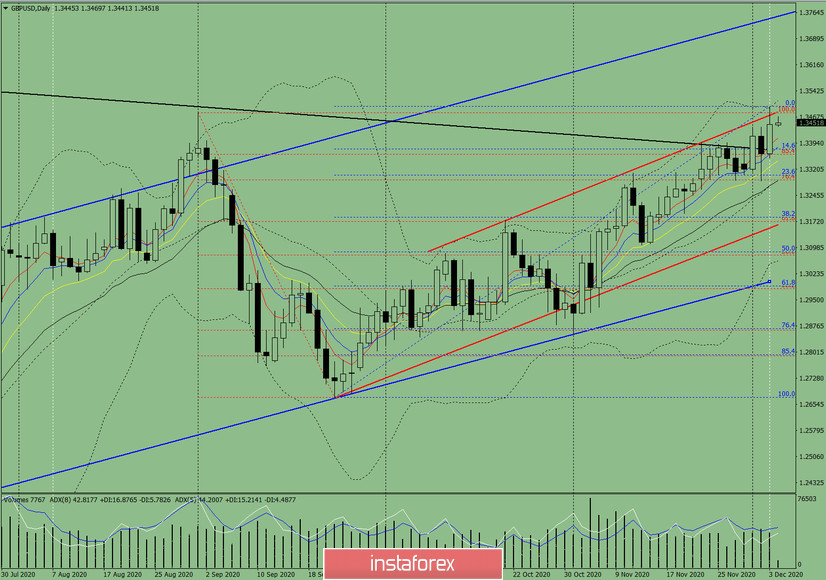
Figure 1 (daily chart).
Complex Analysis:
- Indicator Analysis - up
- Fibonacci Levels - up
- Volumes - up
- Candle Analysis - up
- Trend Analysis - up
- Bollinger Bands - up
- Weekly Chart - up
General Conclusion:
Today, the price will try to continue going up from the level of 1.3445 (closing of yesterday's daily candle) with the target of 1.3482 at the resistance line (red bold line). When this line is reached, the price will continue to go up with the target of 1.3753 at the old resistance line (blue bold line).
Alternative scenario: when going up and reaching the target of 1.3482 at the resistance line (red bold line), there will be a work going down with the target of 1.3377 at the pullback level of 14.6% (red dotted line).