 English
  Русский
 Bahasa Indonesia
 Bahasa Malay
 ไทย
ไทย Español
 Deutsch
 Български
 Français
 Tiếng Việt
 中文
中文 বাংলা
বাংলা हिन्दी
 Čeština
 Українська
 Română

Yesterday, the pair went down and tested almost at the historical support level of 1.2073 (blue dotted line) and then went up, closing the daily candle at 1.2110. Today, the price may continue to go down according to the economic calendar news, it is expected at 10.00 UTC (Euro) and 12.00 UTC (dollar)
Trend Analysis (Fig. 1).
Today, the market may continue to go downward from the level of 1.2110 (yesterday's closing daily candle) with the target of 1.2073 at historical support level (blue dotted line). If this line will be tested, there will be a work going down with the target of 1.2041 at the retracement level of 23.6% (red dotted line).
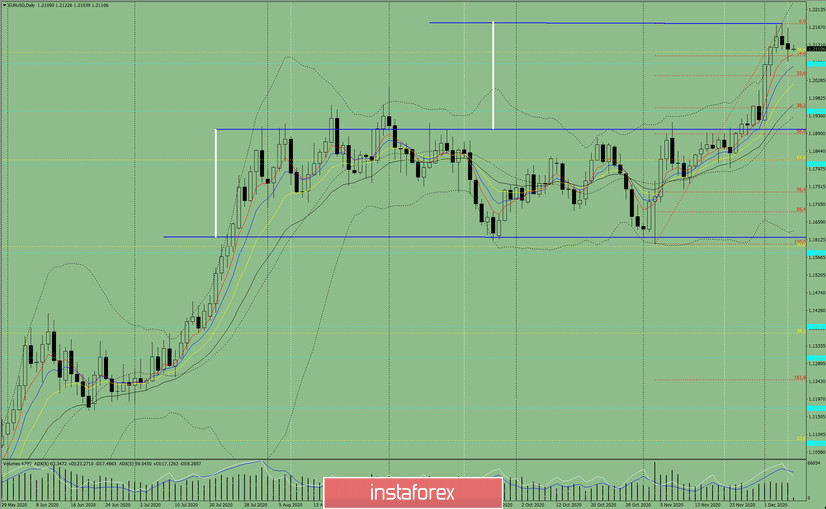
Figure 1 (daily chart).
Complex Analysis:
- Indicator Analysis - down
- Fibonacci Levels - down
- Volumes - down
- Technical Analysis - down
- Trend Analysis - down
- Bollinger Bands - down
- Weekly Chart - down
General Conclusion:
Today, the price may continue to go downward from the level of 1.2110 (yesterday's closing daily candle) with the target of 1.2073 at the historical support level (blue dotted line). If this line will be tested, it will continue to go down with the target of 1.2041 at the resistance level of 23.6% (red dotted line).
Unlikely scenario: when working down to reach the historical support level of 1.2073 (blue dotted line), there will be a work going up with the target of 1.2102 at the rollback level of 76.4% (yellow dotted line).