 English
  Русский
 Bahasa Indonesia
 Bahasa Malay
 ไทย
ไทย Español
 Deutsch
 Български
 Français
 Tiếng Việt
 中文
中文 বাংলা
বাংলা हिन्दी
 Čeština
 Українська
 Română

Technical outlook:
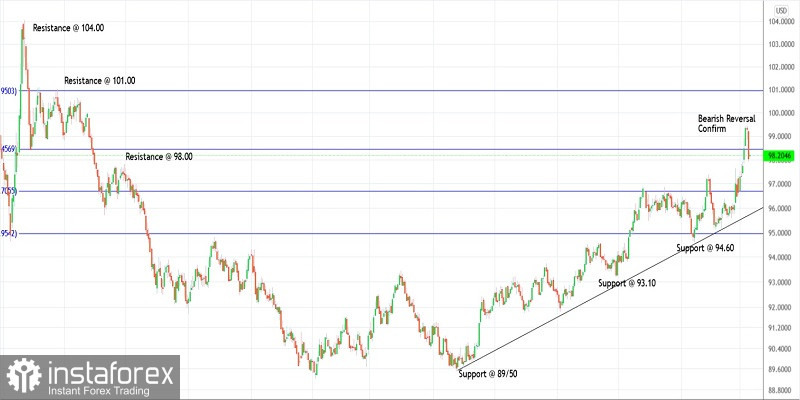
The US dollar index dropped from 99.50-60 levels and printed a low at 97.93 levels on Wednesday at close. The index has produced a classic Evening Star candlestick pattern on the daily chart as labeled here. Bears remain inclined to stay in control and hold prices below the 99.50-60 mark going forward.
The index was producing a larger degree corrective wave since 89.20 lows in January 2021. It had earlier dropped between 104.00 and 89.20 levels earlier carving a meaningful bearish boundary. Bulls have managed to push prices through the Fibonacci 0.618 retracement around 99.50 levels. Watch out for a turn lower from here towards 89.20 in the next several weeks.
The above presented wave structure suggests that US dollar index is setting up for a meaningful drop below 89.20 to complete the pattern, which had begun from 104.00 levels, A break below 95.00 and subsequently its trend line support will confirm that a meaningful top is in place around 99.50 mark and that bears are back in control.
Trading plan:
Potential drop to 95.00 against 100.00
Good luck!