 English
  Русский
 Bahasa Indonesia
 Bahasa Malay
 ไทย
ไทย Español
 Deutsch
 Български
 Français
 Tiếng Việt
 中文
中文 বাংলা
বাংলা हिन्दी
 Čeština
 Українська
 Română
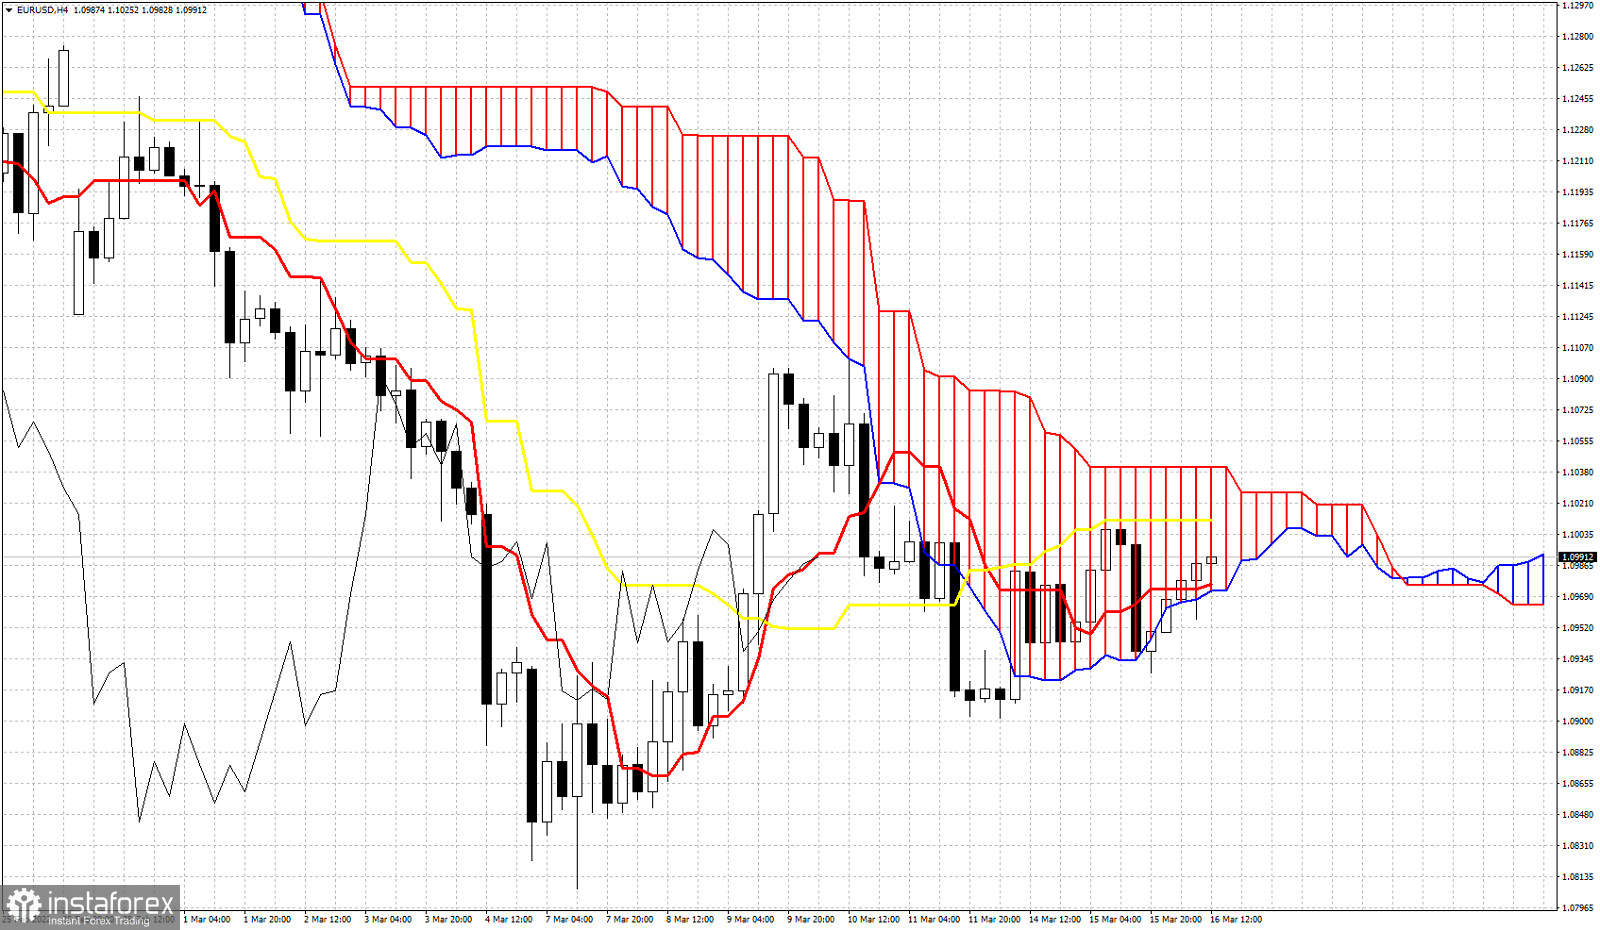
EURUSD in ichimoku cloud terms has turned trend to neutral from bearish in the 4 hour chart. We mentioned in previous posts using simple technical analysis that there are signs of a possible trend reversal.
 Relevance until
EURUSD in ichimoku cloud terms has turned trend to neutral from bearish in the 4 hour chart. We mentioned in previous posts using simple technical analysis that there are signs of a possible trend reversal.