 English
  Русский
 Bahasa Indonesia
 Bahasa Malay
 ไทย
ไทย Español
 Deutsch
 Български
 Français
 Tiếng Việt
 中文
中文 বাংলা
বাংলা हिन्दी
 Čeština
 Українська
 Română

EUR / USD climbed up on Wednesday, moving above 1.2275 (yellow dashed line), which is also the 85.4% retracement level. Today, there is a high chance that this bullish move will continue, however, it would only be inside a narrow sideways channel, since markets are closed in many countries due to the New Year celebration.
Trend analysis (Fig. 1)
Today, the euro may jump from 1.2296 (closing of yesterday's daily candle) to 1.2346 (black dotted line), which is also the upper border of the Bollinger line. And, after testing this level, there is a chance that the bears will work for a pullback, the target of which is 1.2275 (yellow dashed line) or the 85.4% retracement level.
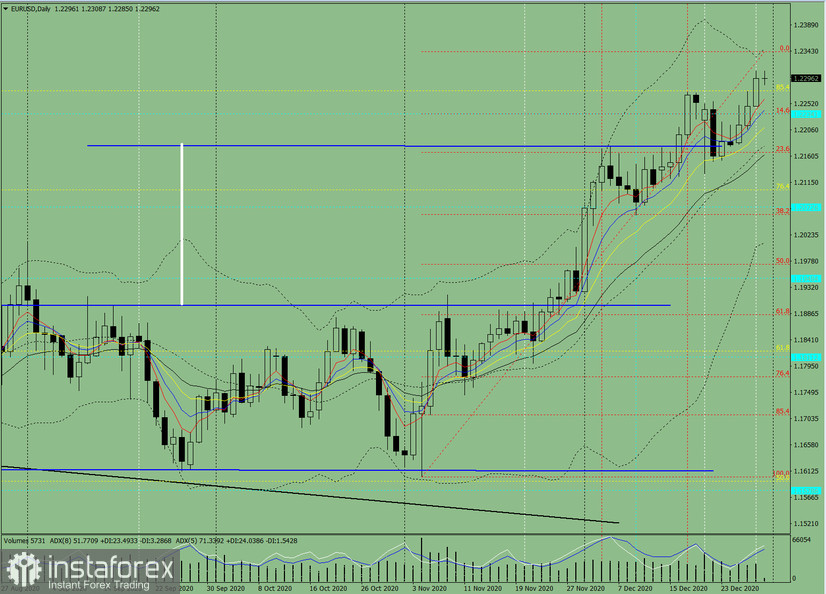
Figure: 1 (daily chart).
Comprehensive analysis:
- Indicator analysis - up;
- Fibonacci levels - up;
- Volumes - up;
- Candlestick analysis - down;
- Trend analysis - up;
- Bollinger lines - up;
- Weekly chart - up.
General conclusion:
The euro may move from 1.2296 (closing of yesterday's daily candle) to 1.2346 (black dotted line) today, which is also the upper border of the Bollinger line. And after the quote tests this level, the bears may work for a pullback to 1.2275 (yellow dashed line), which is also the 85.4% retracement level.
Alternative scenario: price may drop from 1.2296 (closing of yesterday's daily candle) to 1.2234 (blue dashed line).