 English
  Русский
 Bahasa Indonesia
 Bahasa Malay
 ไทย
ไทย Español
 Deutsch
 Български
 Français
 Tiếng Việt
 中文
中文 বাংলা
বাংলা हिन्दी
 Čeština
 Українська
 Română

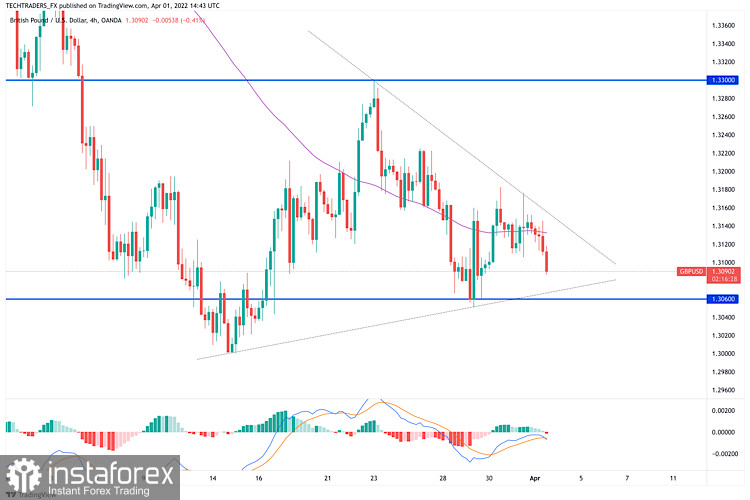
GBP/USD came under renewed bearish pressure and edged lower toward 1.3100 in the early American session. The US Dollar Index stays in positive territory after the data showed a stronger-expected increase in wage inflation in March.
The Relative Strength Index (RSI) indicator on the four-hour chart is edging lower below 50 and GBP/USD stays below the 100-period and the 50-period SMA, pointing to a bearish shift in the near-term technical outlook
1.3100 (psychological level, Fibonacci 23.6% retracement of the latest downtrend) aligns as key support. With a daily close below that level, additional losses toward 1.3050 (static level) and 1.3000 (psychological level, static level) could be witnessed.
On the upside, 1.3135 (100-period SMA) could be seen as interim resistance before 1.3160 (static level, Fibonacci 38.2% retracement, 50-period SMA) and 1.3200 (psychological level, Fibonacci 50% retracement).