 English
  Русский
 Bahasa Indonesia
 Bahasa Malay
 ไทย
ไทย Español
 Deutsch
 Български
 Français
 Tiếng Việt
 中文
中文 বাংলা
বাংলা हिन्दी
 Čeština
 Українська
 Română
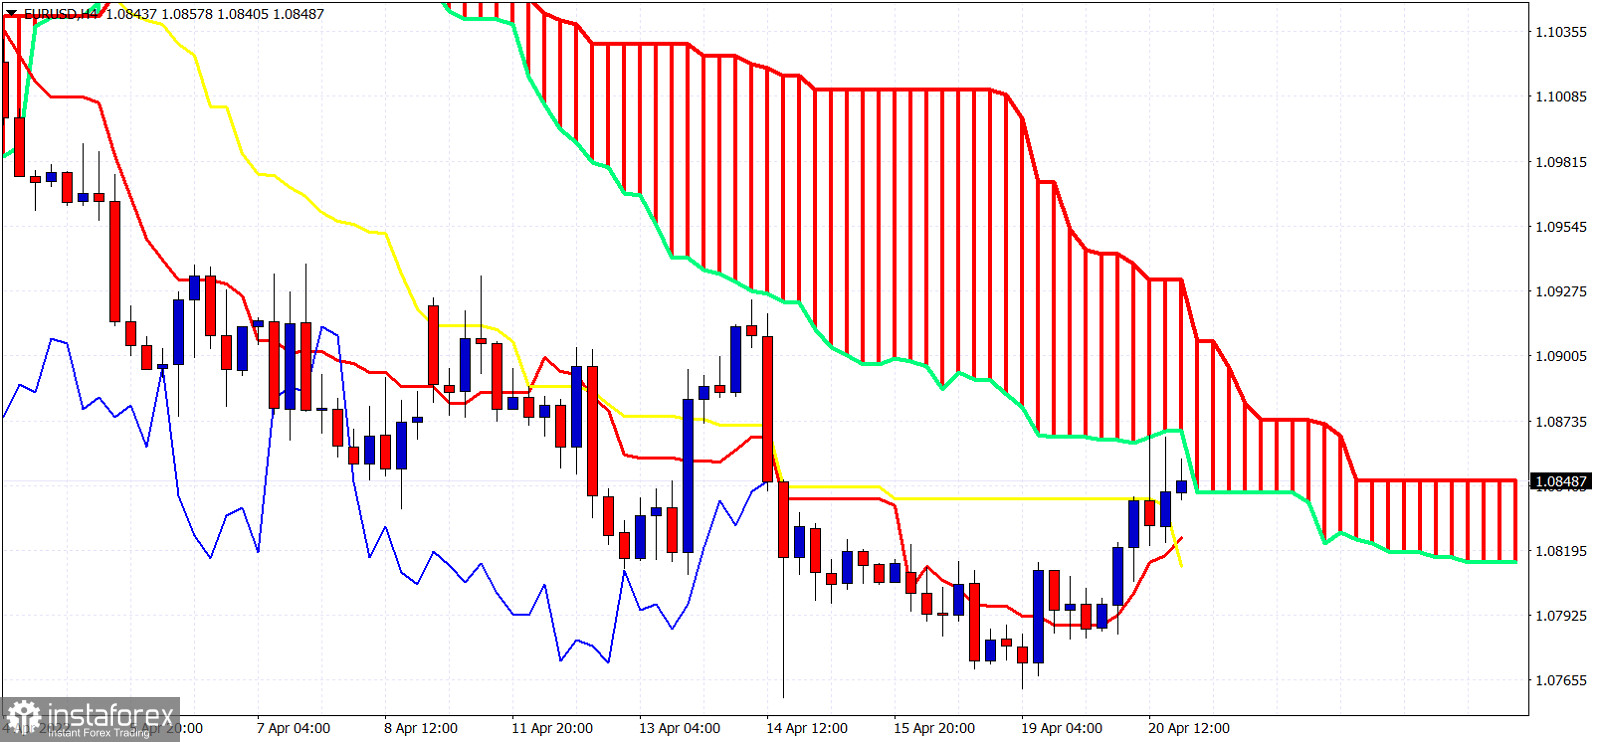
EURUSD yesterday gave us the first sign of strength by closing the 4 hour candlestick above the tenkan-sen. In previous posts we noted that a bounce higher was justified. Price reached the first important resistance level at 1.0870.
 Relevance until
EURUSD yesterday gave us the first sign of strength by closing the 4 hour candlestick above the tenkan-sen. In previous posts we noted that a bounce higher was justified. Price reached the first important resistance level at 1.0870.