 English
  Русский
 Bahasa Indonesia
 Bahasa Malay
 ไทย
ไทย Español
 Deutsch
 Български
 Français
 Tiếng Việt
 中文
中文 বাংলা
বাংলা हिन्दी
 Čeština
 Українська
 Română

Gold price reached our short-term target and important Fibonacci resistance at $1,906 as we expected from our analysis yesterday. However bulls were unable to keep price above $1,900 and we see Gold price under pressure now.
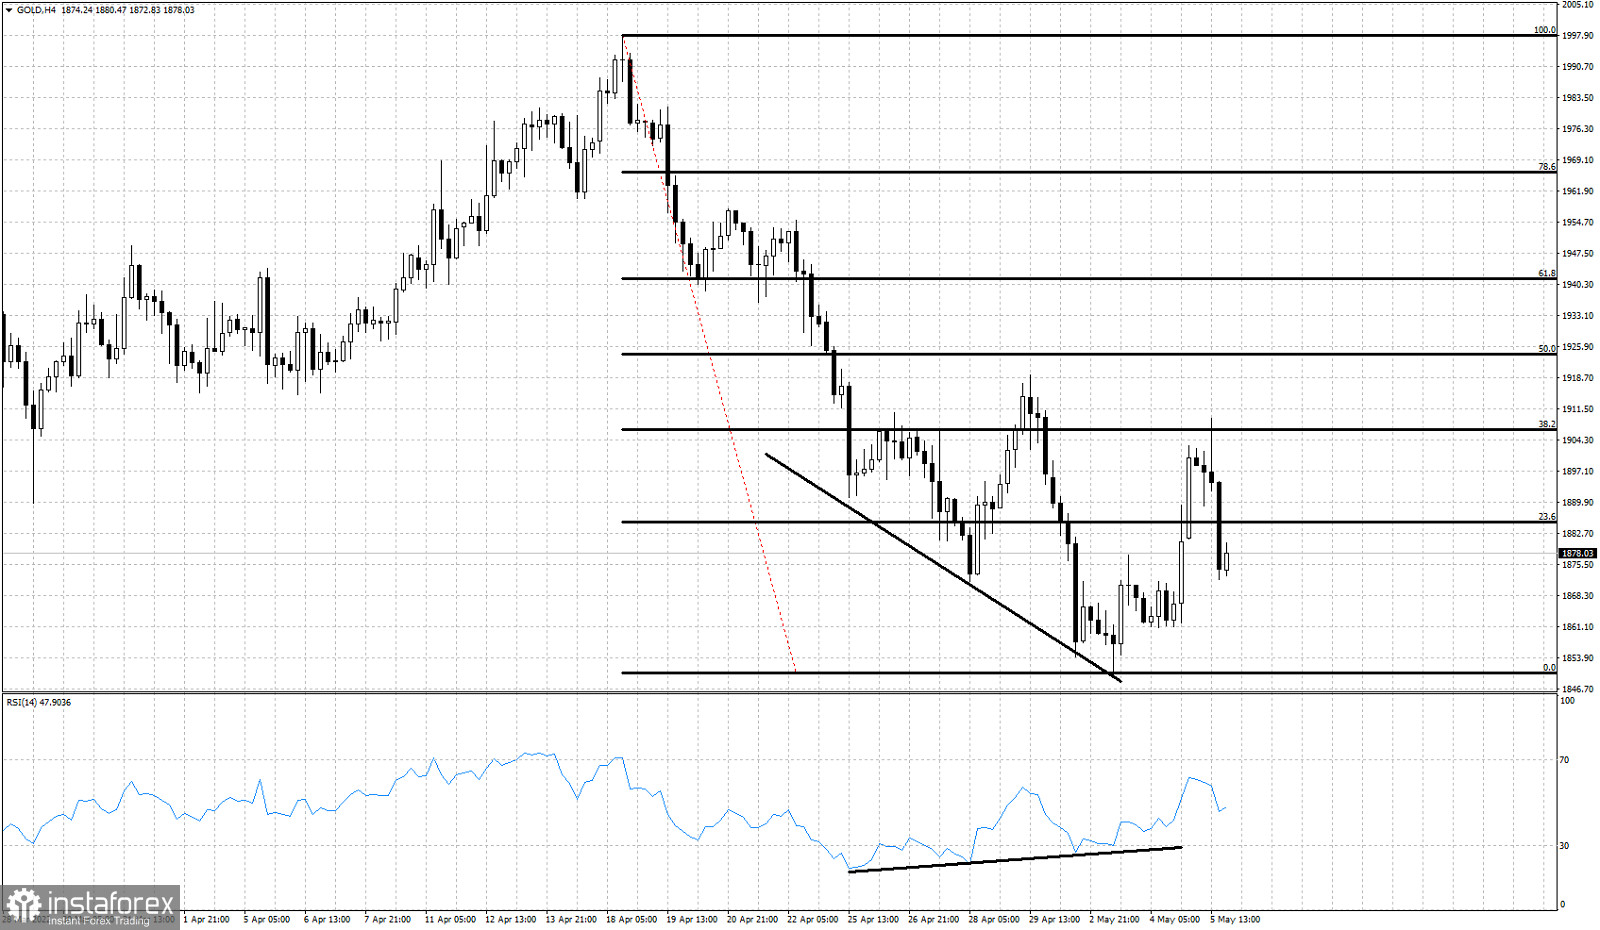
Black horizontal lines- Fibonacci retracements
Gold price managed to reach the 38% Fibonacci retracement only to get rejected. Bulls did not put any fight. Bulls were not strong enough to break this short-term resistance. Price has pulled back towards $1,880-75 and so far we see a higher low. Bulls need to be very careful as a move below $1,860 would be a bearish sign. If bulls manage to recapture the $1,906 level we will most probably see a move higher towards the 61.8% level at $1,940.