 English
  Русский
 Bahasa Indonesia
 Bahasa Malay
 ไทย
ไทย Español
 Deutsch
 Български
 Français
 Tiếng Việt
 中文
中文 বাংলা
বাংলা हिन्दी
 Čeština
 Українська
 Română

Technically trend remains bearish in JPM as price continues making lower lows and lower highs. However current price formation gives hopes to bulls that not long from now we will see an upward reversal in JPM.
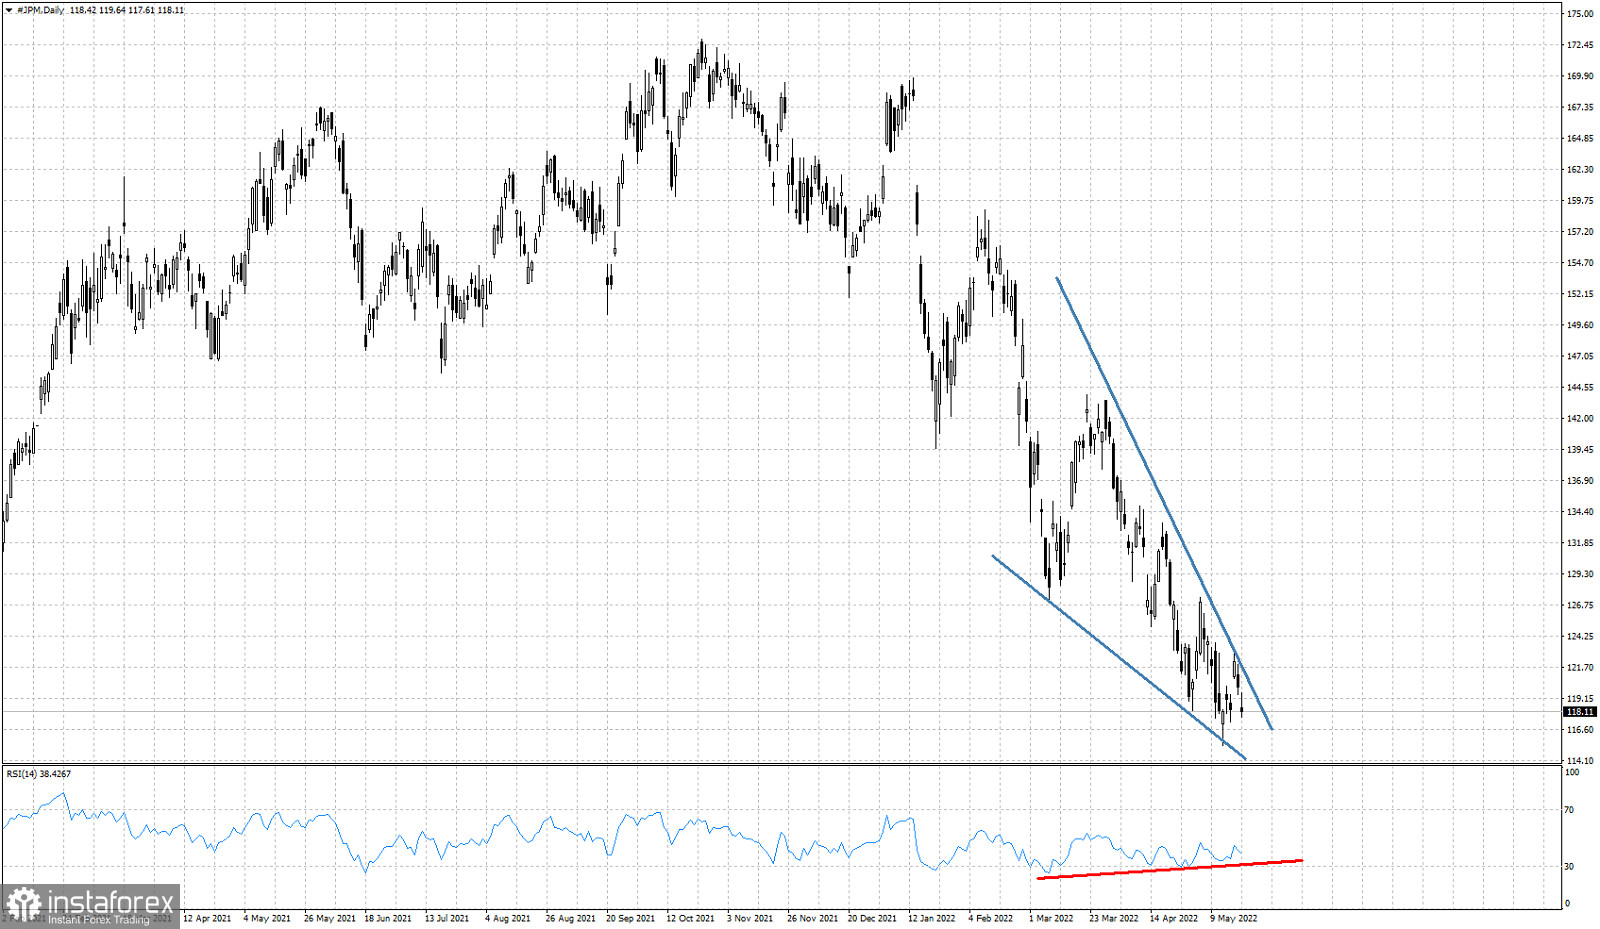
Red line - bullish RSI divergence
In the Daily chart of JPM stock, price has formed a bullish wedge pattern. Resistance by the upper wedge boundary is at $121.50. A break above this level would be a sign of strength. The RSI is divergence as it is making higher lows in contrast to price making lower lows. This bullish divergence is not a reversal signal, but only a warning that the downtrend is weakening. So traders need to be cautious as the chances of a reversal have increased.