 English
  Русский
 Bahasa Indonesia
 Bahasa Malay
 ไทย
ไทย Español
 Deutsch
 Български
 Français
 Tiếng Việt
 中文
中文 বাংলা
বাংলা हिन्दी
 Čeština
 Українська
 Română

GBPUSD is trading around 1.2477. Price is below short-term resistance at 1.2515, but has already formed a higher low. This higher low gives hopes to bulls for an upward break out. If resistance is broken, we should then expect GBPUSD to rise towards 1.2670-1.2680.
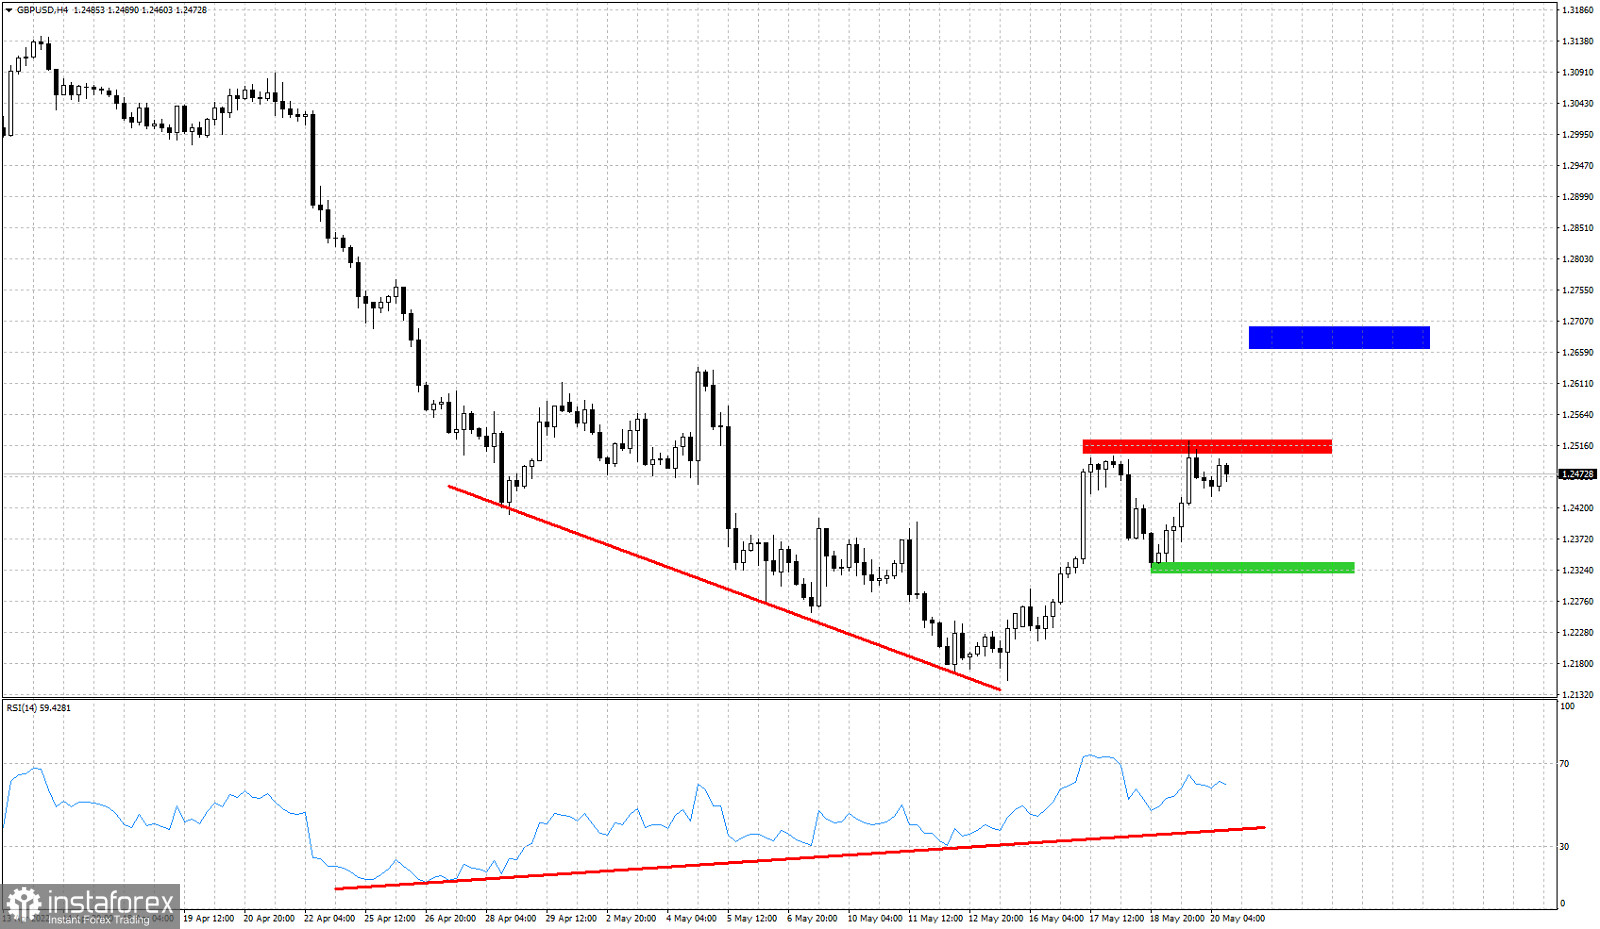
Green rectangle- short-term support
Red rectangle- resistance
Blue rectangle- target if resistance is broken
GBPUSD is challenging the red resistance. If broken we get a bullish signal and our target will be the blue rectangle. This bullish scenario is valid as long as price is above the green support area. The RSI bullish divergence we identified a few days ago provided the upward bounce we were expecting. Will GBPUSD continue higher? There are increased chances of this happening.