 English
  Русский
 Bahasa Indonesia
 Bahasa Malay
 ไทย
ไทย Español
 Deutsch
 Български
 Français
 Tiếng Việt
 中文
中文 বাংলা
বাংলা हिन्दी
 Čeština
 Українська
 Română

INTC ended last week on a multi year lower low. In previous posts we talked about price challenging major horizontal support that was respected for the last 5 years. Last week price traded below $42,50 for the first time since 2017.
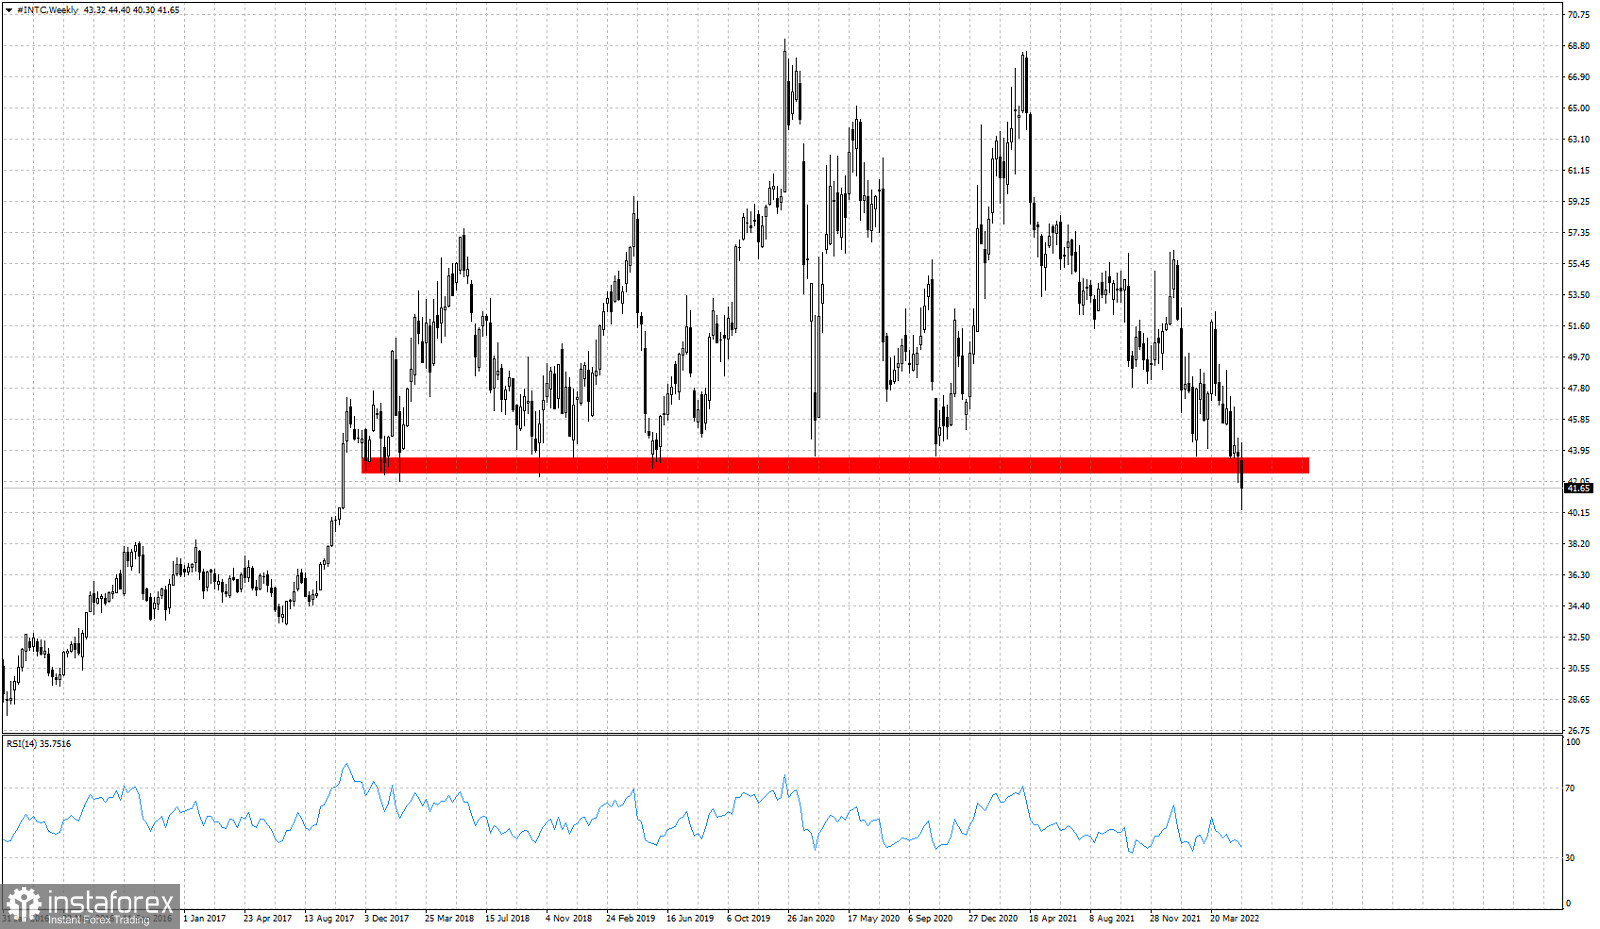
Is this a fake break down or a new bearish signal? The RSI does not confirm the new weekly low as it is making a higher low. This bullish divergence is something we should not ignore, however such a bullish divergence is not a reversal signal, but only a warning to bears. Nevertheless price broke below the support and closed last week below $42. A back test of the previous support and now resistance is expected. Technically trend remains bearish as price continues making lower lows and lower highs. If bulls manage to recapture $42,50 soon, we could be talking about a fake break down.