 English
  Русский
 Bahasa Indonesia
 Bahasa Malay
 ไทย
ไทย Español
 Deutsch
 Български
 Français
 Tiếng Việt
 中文
中文 বাংলা
বাংলা हिन्दी
 Čeština
 Українська
 Română

GBPUSD has broken above the short-term resistance at 1.2520, reached as high as 1.26 and price is now back testing the break out level. Price continues making higher highs and higher lows, respecting the upward sloping support trend line from its recent lows.
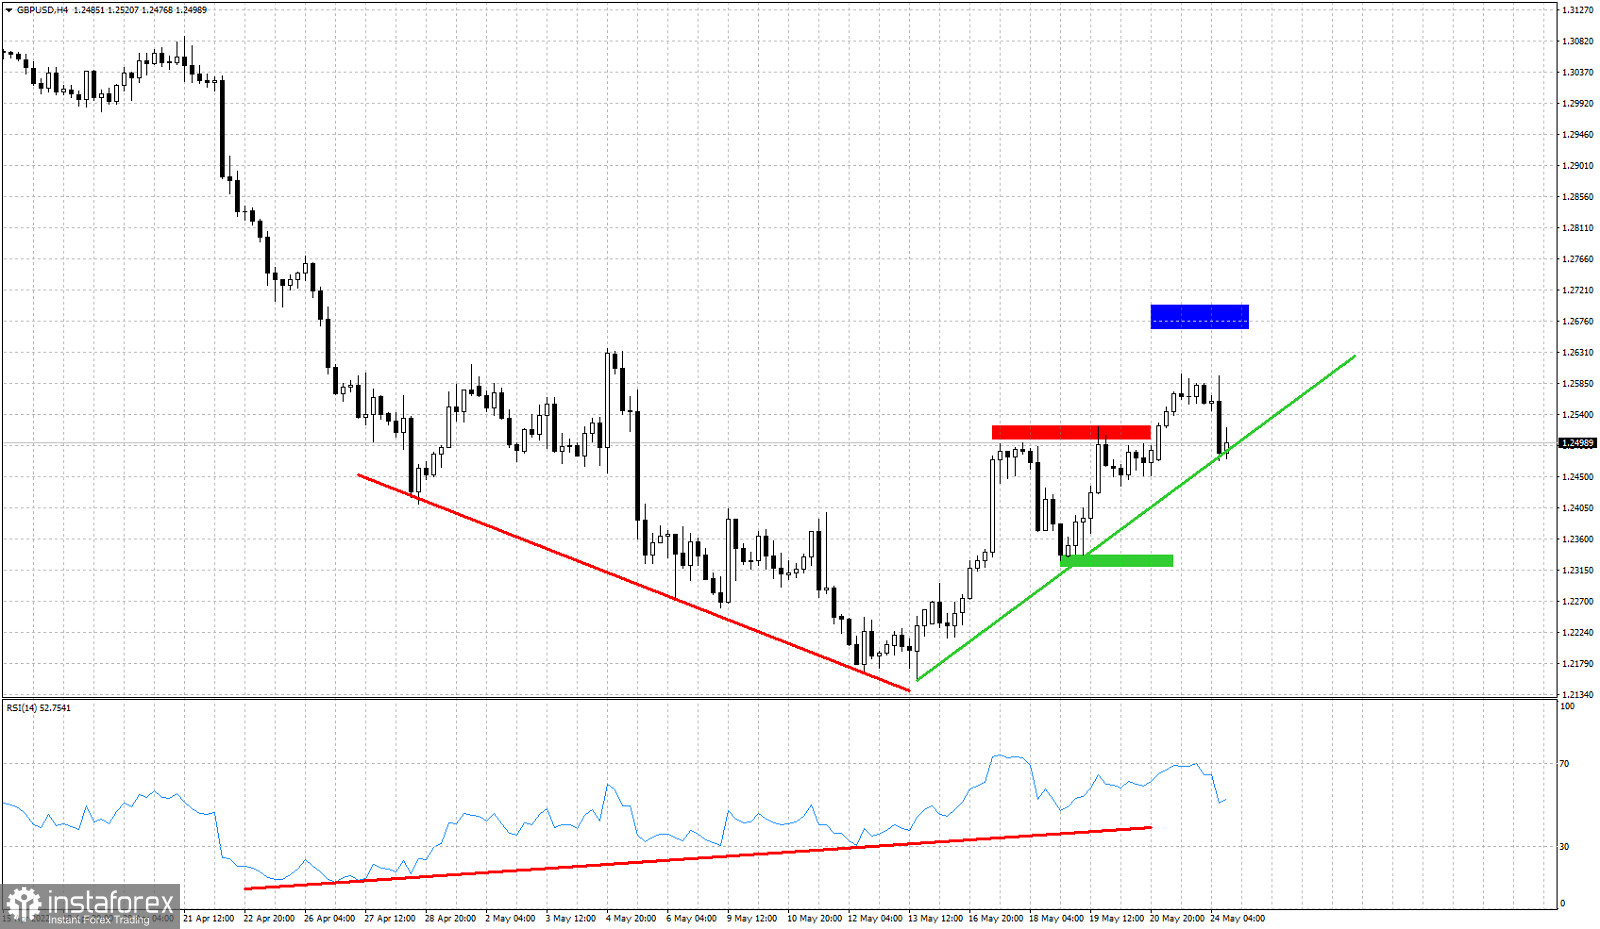
Blue rectangle- target
Red rectangle- resistance
Green rectangle -horizontal support
Green line- support trend line
GBPUSD is expected to continue higher towards the blue rectangle. This is our short-term bounce target. We were warning traders of a possible reversal to the upside since the bullish RSI divergence was seen. Back when price was trading around 1.22. Our bullish setup has been fulfilled and in the near term we expect more upside to be seen as long as price holds above the green rectangle.