 English
  Русский
 Bahasa Indonesia
 Bahasa Malay
 ไทย
ไทย Español
 Deutsch
 Български
 Français
 Tiếng Việt
 中文
中文 বাংলা
বাংলা हिन्दी
 Čeština
 Українська
 Română

Ripple continues to move sideways as the price of Bitcoin is trapped within an extended range pattern. XRP/USD is traded at 0.3999 at the time of writing, standing right above the 0.3950 critical support.
In the last 24 hours, XRP/USD is down by 0.92% and by 1.86% in the last 7 days. Personally, I'm waiting for BTC/USD to escape from its range before taking action on altcoins. Bitcoin's drop could force Ripple to drop as well.
XRP/USD Triangle Pattern!
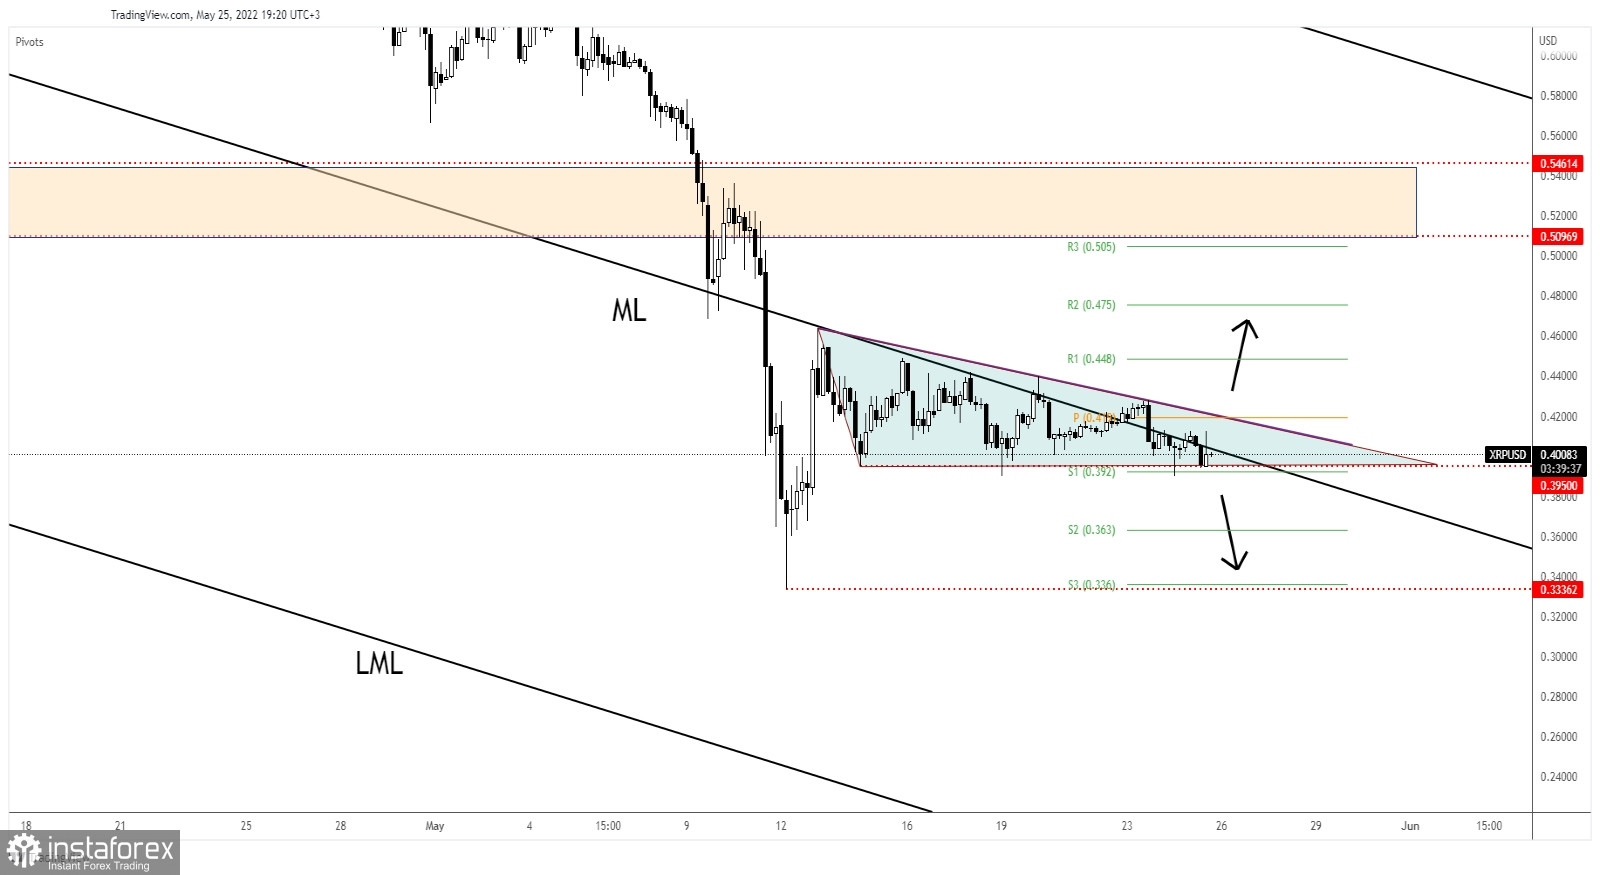
As you can see on the h4 chart, XRP/USD failed to stay above the descending pitchfork's median line (ML) signaling strong sellers. The price action developed a triangle pattern, so we'll have to wait for a valid breakout.
Escaping from this pattern could bring new trading opportunities. The bias remains bearish after failing to make a new higher high. Only a valid breakout above the triangle's resistance could signal a larger rebound.
XRP/USD Forecast!
A new lower low, dropping and closing below 0.3900 may activate more declines towards the 0.3336 key level.
An upside breakout from this triangle could signal a larger growth in the short term.