 English
  Русский
 Bahasa Indonesia
 Bahasa Malay
 ไทย
ไทย Español
 Deutsch
 Български
 Français
 Tiếng Việt
 中文
中文 বাংলা
বাংলা हिन्दी
 Čeština
 Українська
 Română

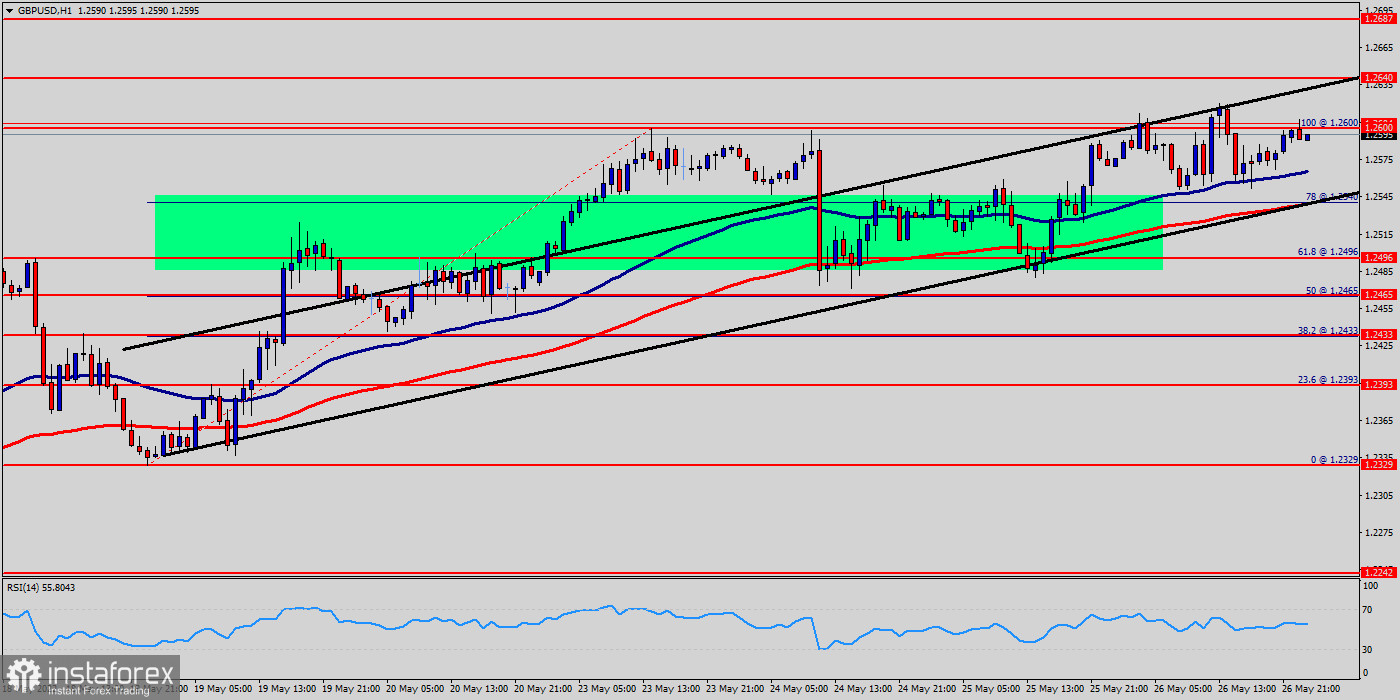
The GBP/USD pair continued moving upwards from the level of 1.2496. Last week, the pair rose from the level of 1.2496 (weekly support) to the top around 1.2600. Today, the first support level is seen at 1.2496 followed by 1.2465, while daily resistance is seen at 1.2640. According to the previous events, the GBP/USD pair is still moving between the levels of 1.2496 and 1.2640; for that we expect a range of 144 pips on Friday. This would suggest a bullish market because the RSI indicator is still in a positive area and does not show any trend-reversal signs. Moreover, the RSI is still signaling that the trend is upward as it remains strong above the moving average (100). This suggests that the pair will probably go up in coming hours.Furthermore, if the trend is able to break out through the first resistance level of 1.2600, we should see the pair climbing towards the new double top (1.2640) to test it. Accordingly, the GBP/USD pair is showing signs of strength following a breakout of the highest level of 1.2600. So, buy above the level of 1.2600 with the first target at 1.2640 in order to test the daily resistance 2. The level of 1.2687 is a good place to take profits. If the trend is able to break the level of 1.2640, then the market will call for a strong bullish market towards the objective of 1.2687 today. On the contrary, if a breakout takes place at the support level of 1.2496, then this scenario may become invalidated. Remember to place a stop loss; it should be set below the second support of 1.2433.