 English
  Русский
 Bahasa Indonesia
 Bahasa Malay
 ไทย
ไทย Español
 Deutsch
 Български
 Français
 Tiếng Việt
 中文
中文 বাংলা
বাংলা हिन्दी
 Čeština
 Українська
 Română

Bitcoin as expected made a break down below the short-term support zone, but it was short lived. Price bounced back up very fast but price continues to trade below short-term resistance. Price is above the horizontal support once again but at the same time it continues making lower highs.
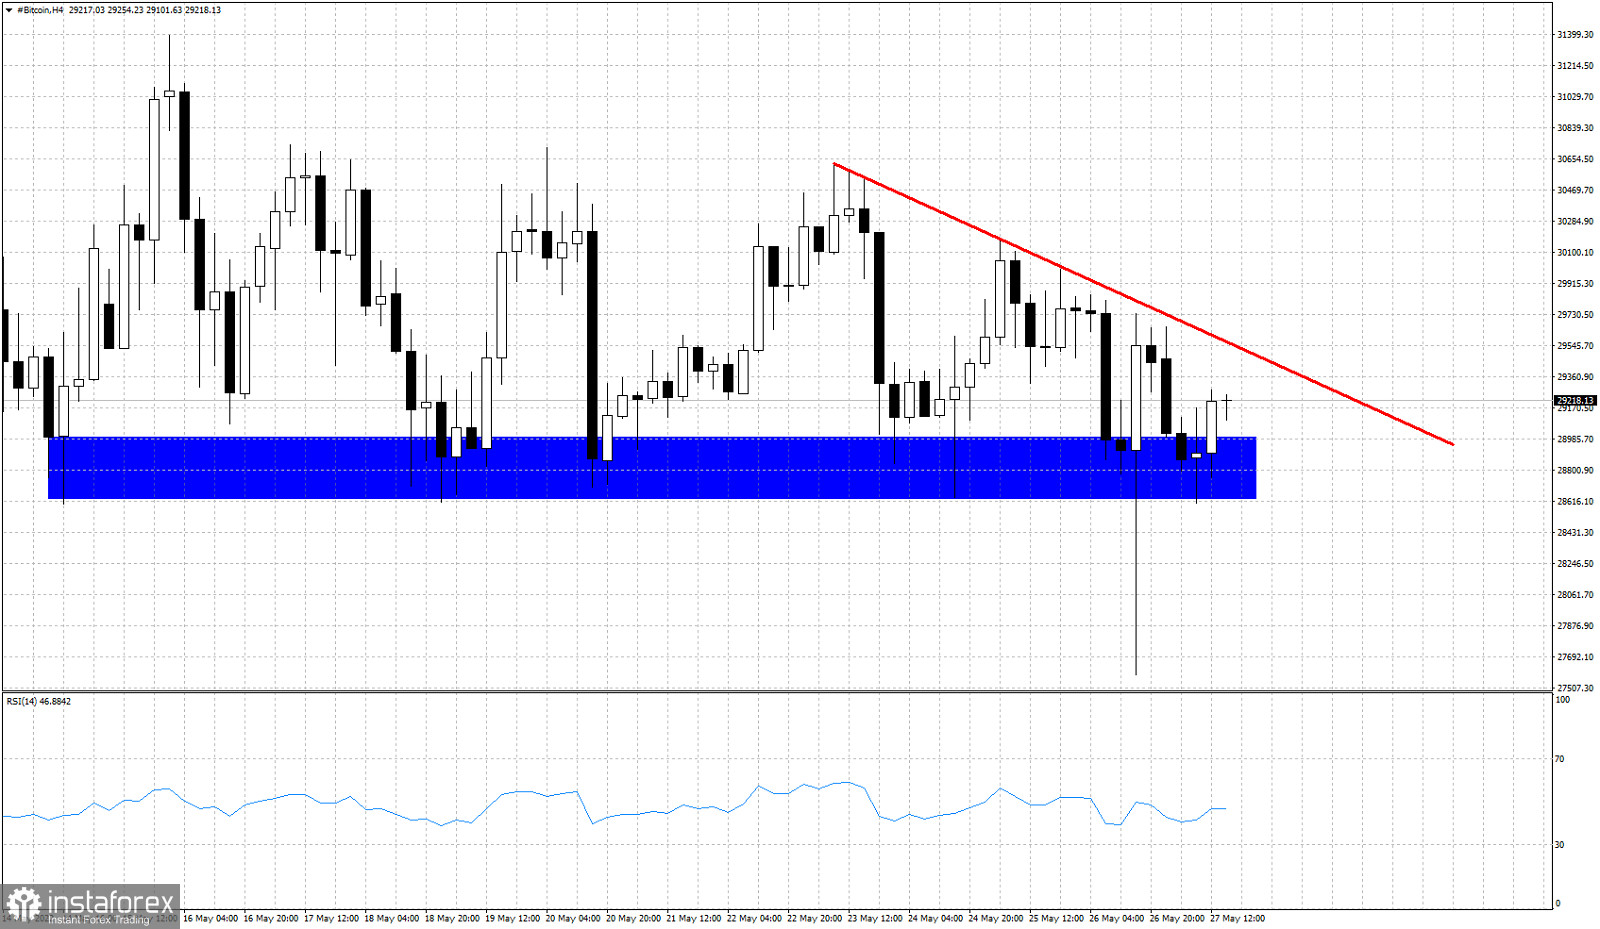
Red line- resistance trend line
Bitcoin broke below support and traded as low as $27,585, while our expectation was a move towards $25,000. Price has resistance at $29,600 where we find the red downward sloping resistance trend line. A second move below the blue horizontal support would be an added sign of weakness that will most probably lead to a move towards $25,000.