 English
  Русский
 Bahasa Indonesia
 Bahasa Malay
 ไทย
ไทย Español
 Deutsch
 Български
 Français
 Tiếng Việt
 中文
中文 বাংলা
বাংলা हिन्दी
 Čeština
 Українська
 Română

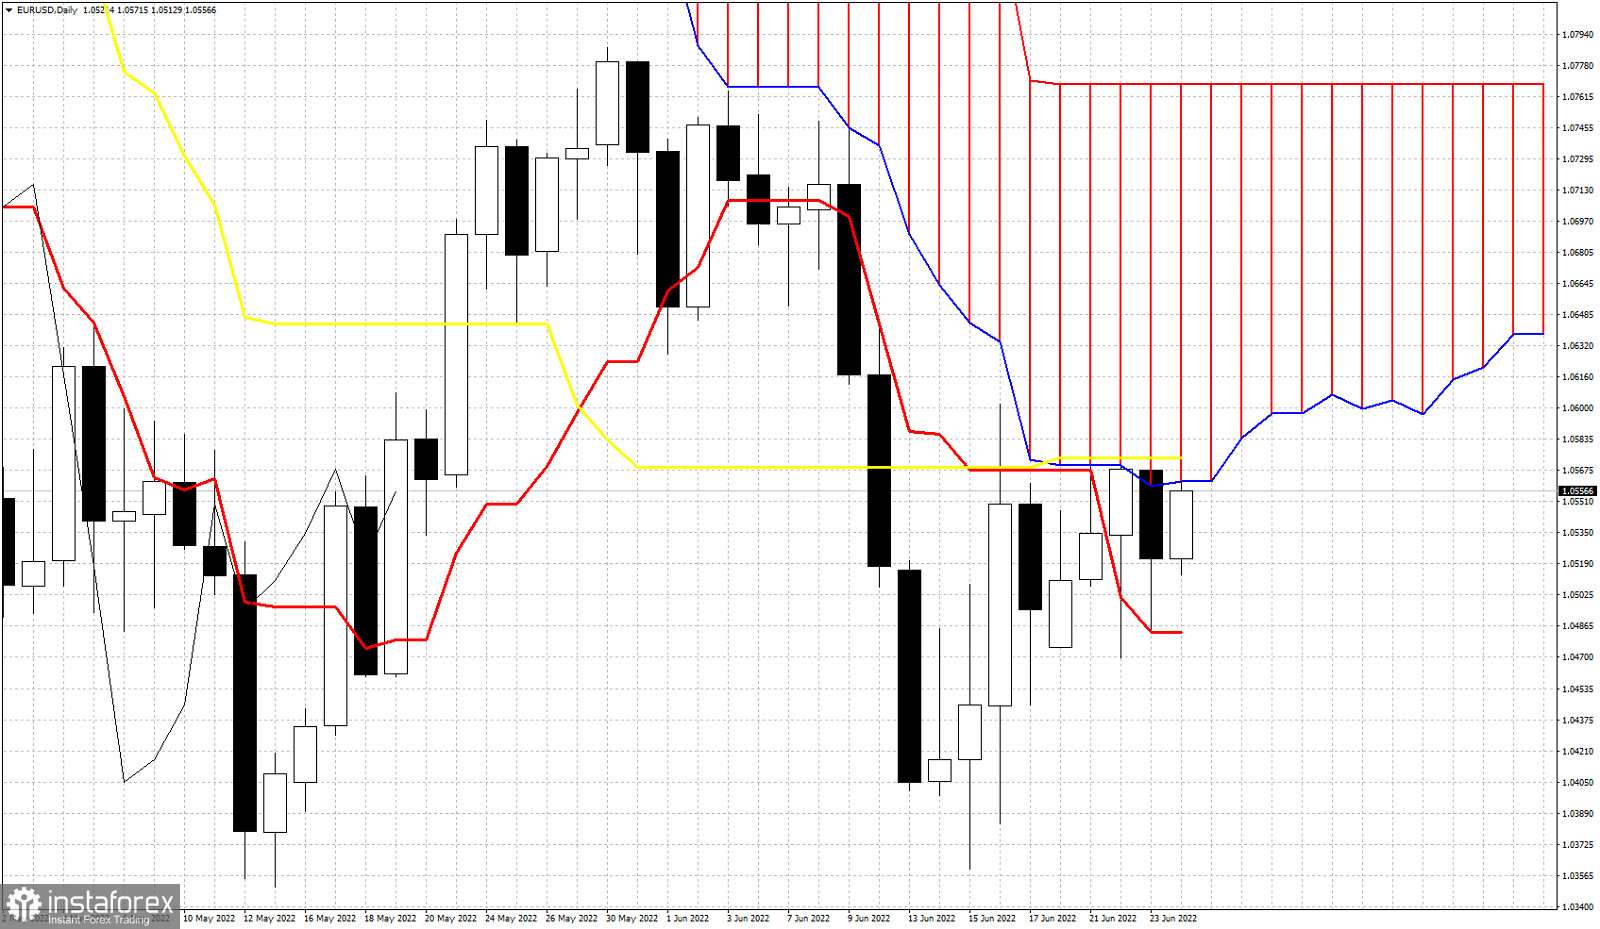
EURUSD tried this past week to rally as Eurozone inflation remains high and the European Central Bank is getting forced to act. We use the Ichimoku cloud indicator in order to identify key resistance levels in order for trend to change to bullish. Trend remains bearish as price is still below the Daily Kumo (cloud). The tenkan-sen (red line indicator) provides support at 1.0480. As long as price is above this level, bulls have hopes for more upside. Last week bulls tried to penetrate inside the cloud, but their success was short lived. Price got rejected but the pull back did not push price below the tenkan-sen. 1.0570 remains a key resistance level on a daily closing basis. This is the first obstacle bulls need to overcome for a trend change to occur. Until then price is vulnerable to more downside.