 English
  Русский
 Bahasa Indonesia
 Bahasa Malay
 ไทย
ไทย Español
 Deutsch
 Български
 Français
 Tiếng Việt
 中文
中文 বাংলা
বাংলা हिन्दी
 Čeština
 Українська
 Română

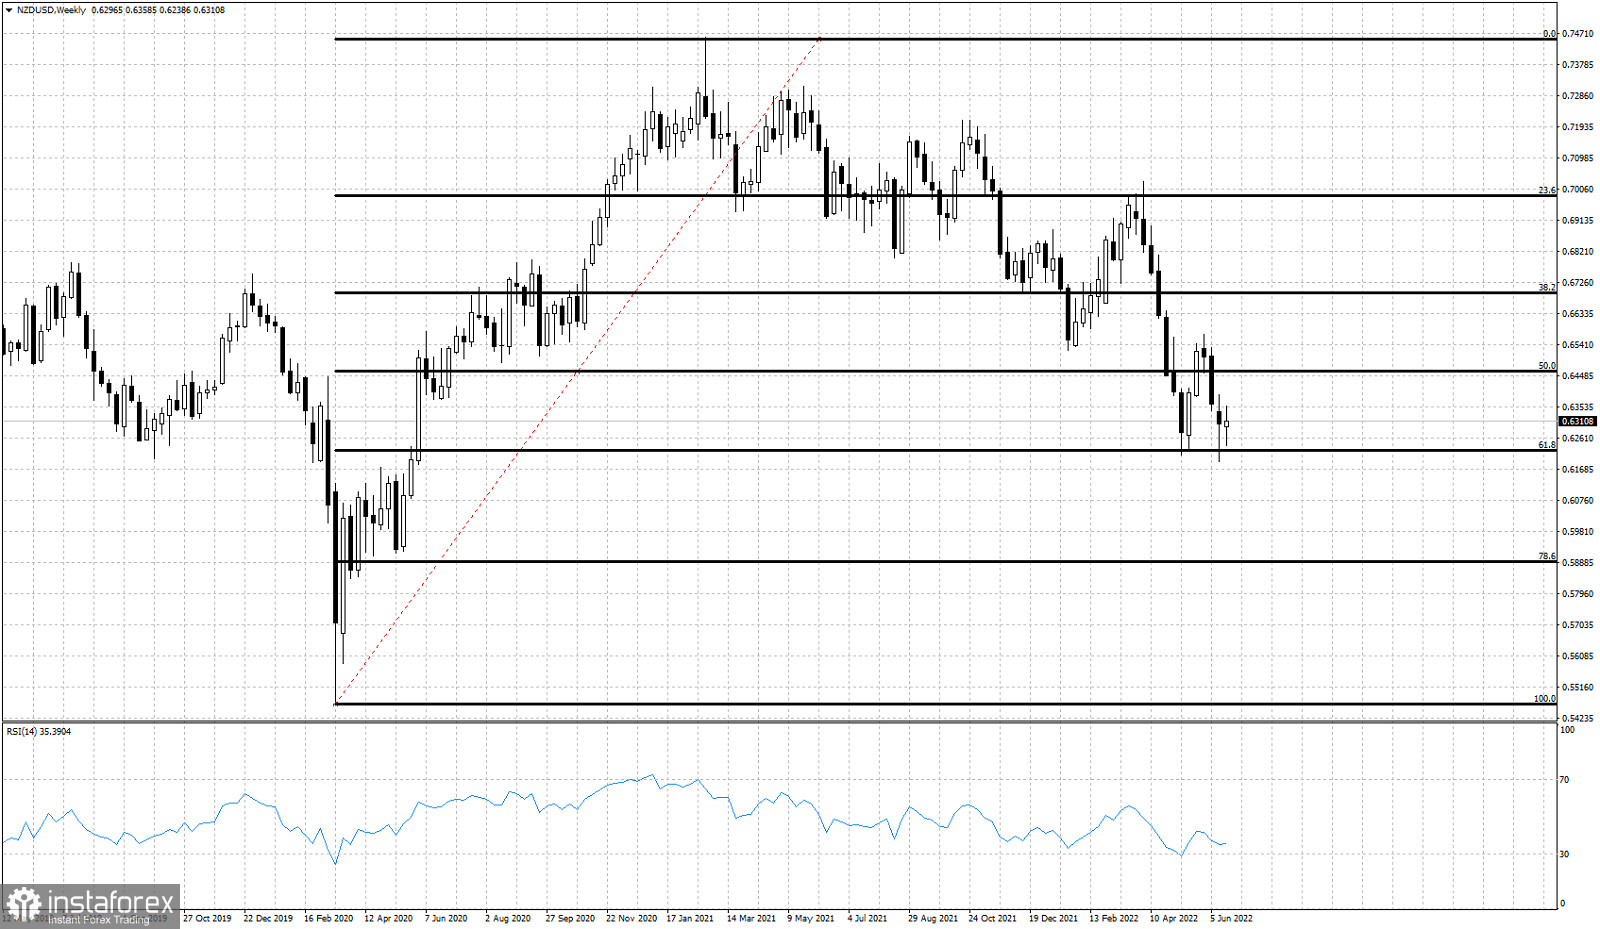
Black lines - Fibonacci retracements
NZDUSD remains in a bearish weekly trend making lower lows and lower highs. This downward trend remains intact since the week of February 21st 2021 and the major weekly reversal candlestick pattern. Since then price has managed to retrace 61.8% of the entire upward move from the 2020 lows to 2021 top. NZDUSD has reached the 61.8% retracement level for the second time and price seems to respect it. A double bottom is being formed here as bears seem unable to break below this key Fibonacci support. NZDUSD has the potential to reverse to the upside and start a new upward move from current levels. The 61.8% retracement level is a level we most often see trend reversals. As long as price holds above last week's lows, we are optimistic that we could see a major reversal to the upside.