 English
  Русский
 Bahasa Indonesia
 Bahasa Malay
 ไทย
ไทย Español
 Deutsch
 Български
 Français
 Tiếng Việt
 中文
中文 বাংলা
বাংলা हिन्दी
 Čeština
 Українська
 Română

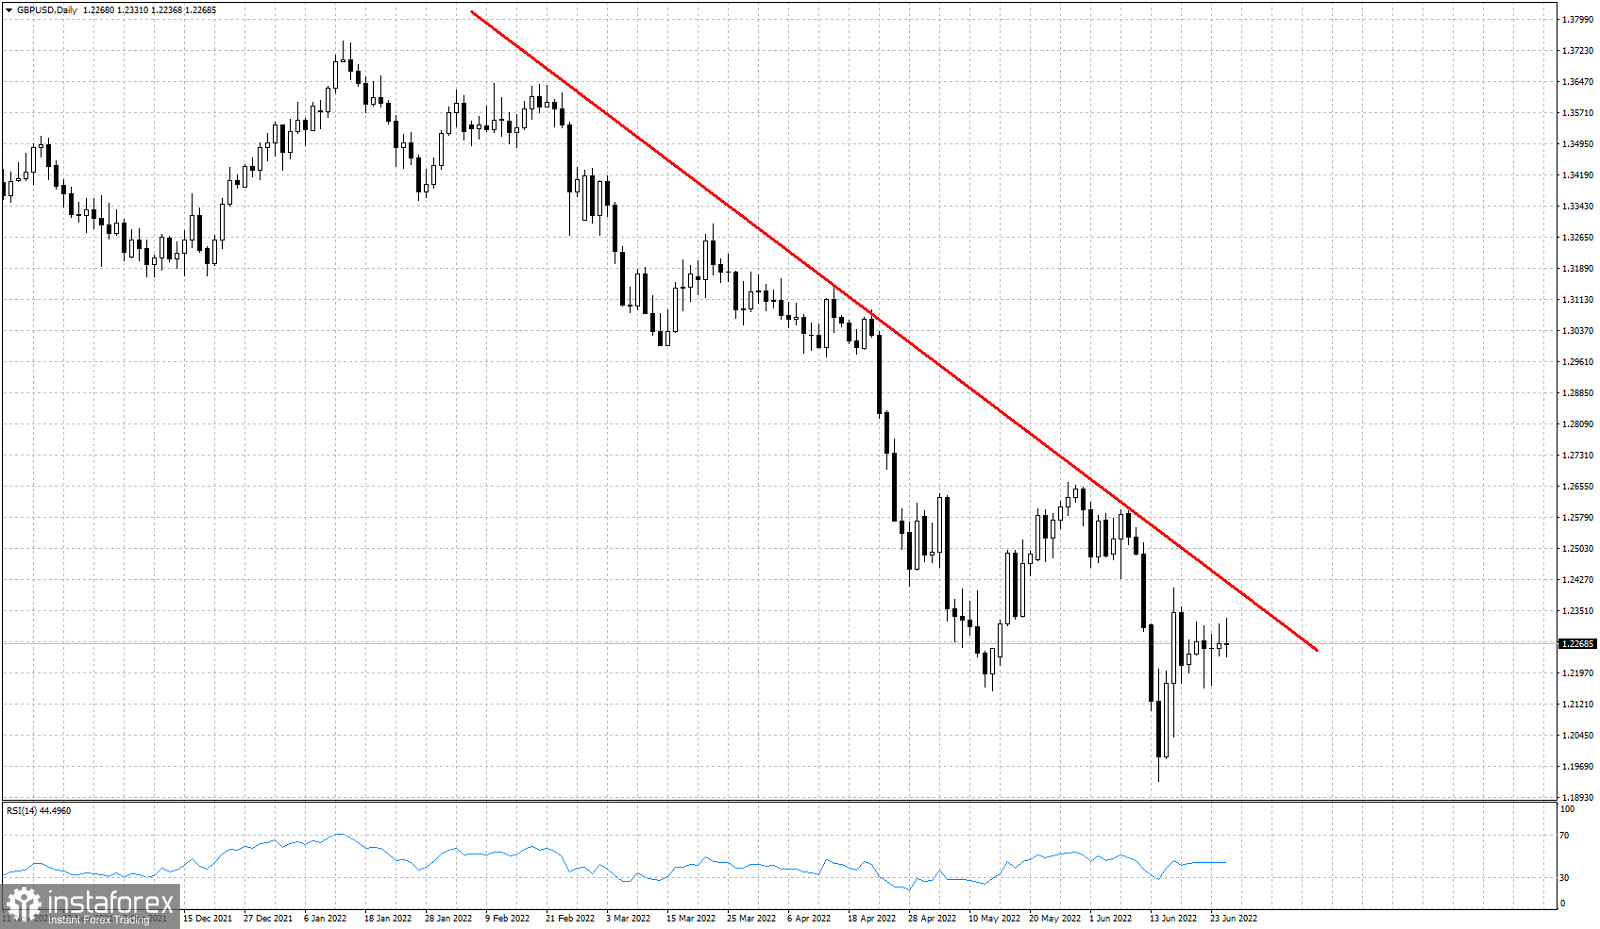
Red line -resistance trend line
GBPUSD continues to trade sideways for the last couple of sessions around 1.2270-1.2330. Medium-term trend remains bearish as price continues to trade below the key downward sloping resistance trend line. Price is making lower lows and lower highs since January of 2022. The RSI has turned higher from oversold levels to neutral territory. A rejection at the red resistance trend line could lead to new lows for GBPUSD towards 1.19. As long as price is below the trend line, we remain bearish. Upside potential is limited to the trend line resistance at 1.2425. Support is found at 1.2150 and a break below this level would be a sign of weakness implying that a new round of selling might be starting over again.