 English
  Русский
 Bahasa Indonesia
 Bahasa Malay
 ไทย
ไทย Español
 Deutsch
 Български
 Français
 Tiếng Việt
 中文
中文 বাংলা
বাংলা हिन्दी
 Čeština
 Українська
 Română

Crypto Industry News:
The average Ethereum gas charge drops to $ 1.57, its lowest level since 2020.
For almost two years, between January 2021 and May 2022, the average gas charge required by the Ethereum network was around $ 40, with the network having its highest average daily gas cost of $ 196,638 on May 1, 2022.
The biggest obstacle to the Ethereum ecosystem's mainstream domination is often attributed to the very high transaction fees - known as gas fees - required to complete a transaction. However, as the average Ethereum gas charges drop to 0.0015 Ether (ETH), the situation will change.
The average transaction fee on the Ethereum blockchain has dropped to 0.0015 ETH or $ 1.57 - a value previously seen in December 2020. However, starting in January 2021, Ethereum gas charges increased due to the hype around non-convertible tokens (NFT), decentralized finance (DeFi) and a promising bull market.
Technical Market Outlook:
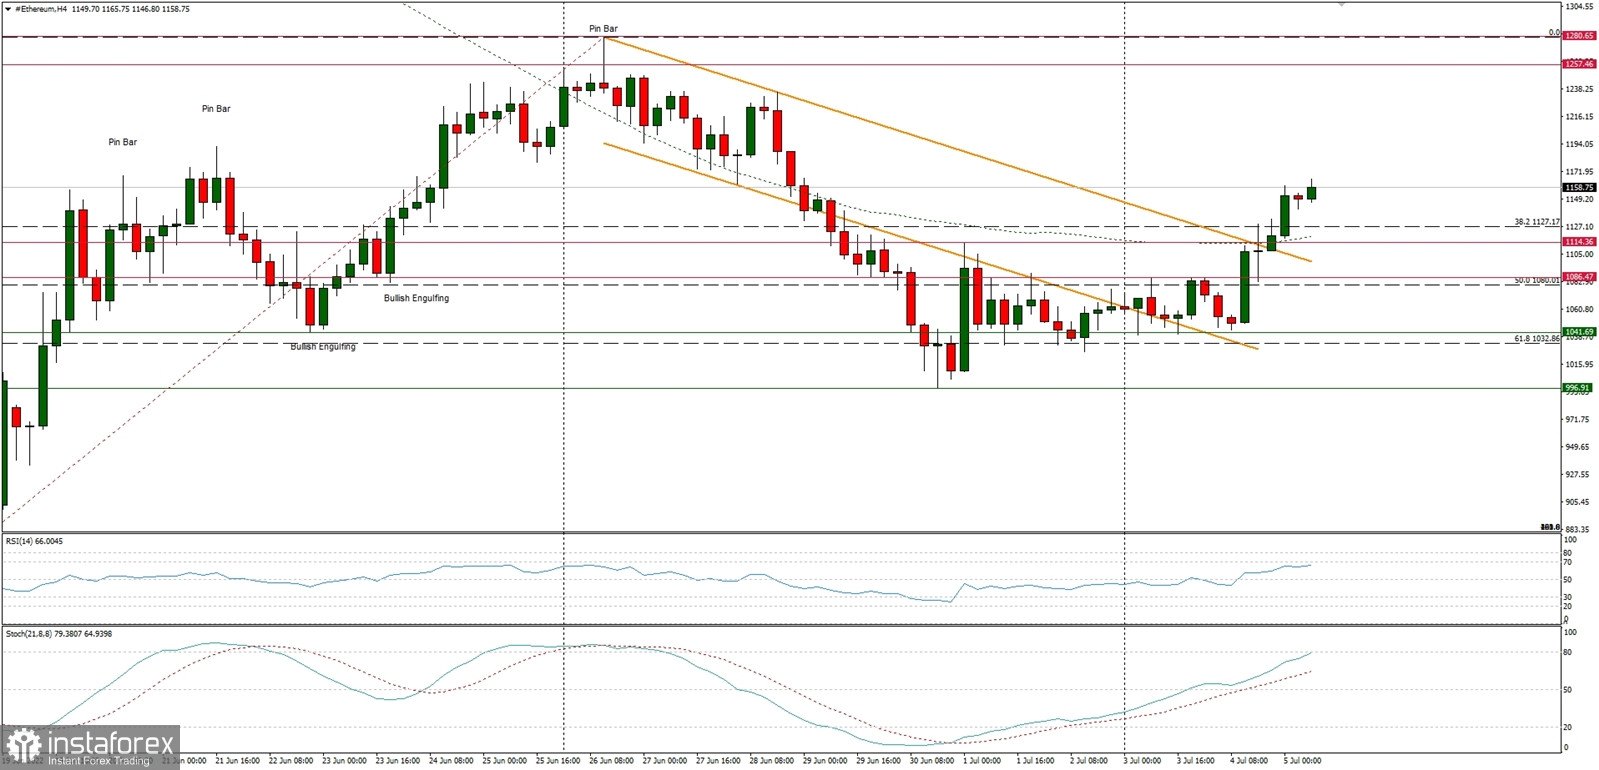
The ETH/USD pair has been seen moving up finally, after the local technical resistance levels had been broken ( $1,086 and $1,114). The technical supports are seen on the levels of $1,041, $1,026 and $996 as well. The larger time frame chart trend remains down and as long as the key short-term technical resistance, located at the level of $1,280, is not clearly violated, the outlook remains bearish.
Weekly Pivot Points:
WR3 - $1,452
WR2 - $1,340
WR1 - $1,207
Weekly Pivot - $1,098
WS1 - $957
WS2 - $839
WS3 - $701
Trading Outlook:
The down trend on the H4, Daily and Weekly time frames had broken below the key long term technical support seen at the level of $1,420 and bears continue to make new lower lows with no problem whatsoever. So far every bounce and attempt to rally is being used to sell Ethereum for a better price by the market participants, so the bearish pressure is still high. The next target for bears is located at the levels below $1,000, like the last swing low seen at $880. Please notice, the down trend is being continued for the 11th consecutive week now.