 English
  Русский
 Bahasa Indonesia
 Bahasa Malay
 ไทย
ไทย Español
 Deutsch
 Български
 Français
 Tiếng Việt
 中文
中文 বাংলা
বাংলা हिन्दी
 Čeština
 Українська
 Română

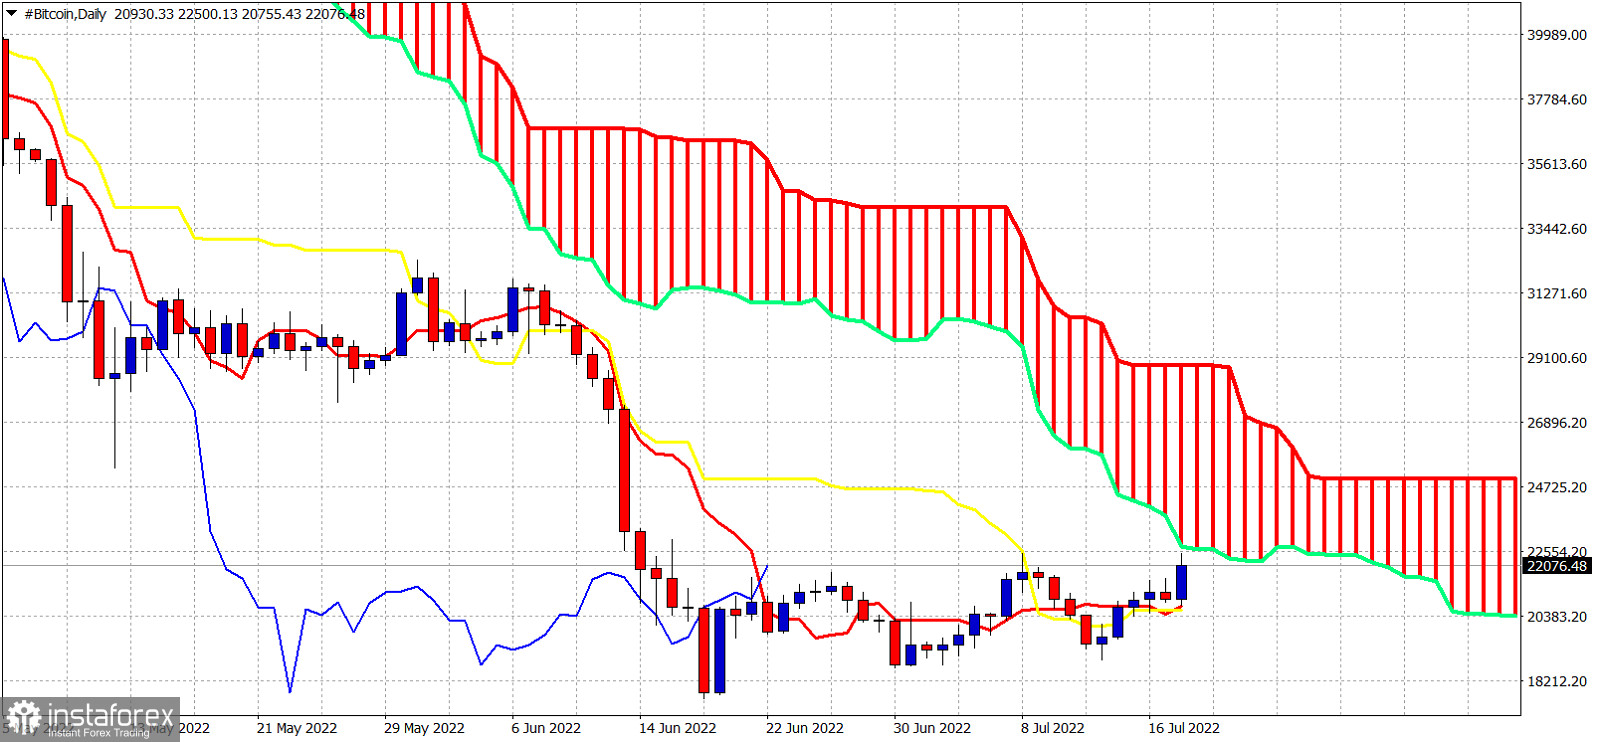
Bitcoin is trading above $22,000. Bitcoin is trading above the high levels of the recent few weeks. However using the Ichimoku cloud indicator we see that price is testing key cloud resistance. Price is above the tenkan-sen (red line indicator) and the kijun-sen (yellow line indicator). This is a good sign, supportive of short-term trend. This support is at $20,700. A break below this level would be a bearish sign. Bitcoin is currently challenging the lower cloud boundary in the Daily chart. On a daily basis trend remains bearish as long as price is below the Kumo. A rejection at the cloud resistance would be a bearish sign and could bring price back towards the short-term support of $20,700.