 English
  Русский
 Bahasa Indonesia
 Bahasa Malay
 ไทย
ไทย Español
 Deutsch
 Български
 Français
 Tiếng Việt
 中文
中文 বাংলা
বাংলা हिन्दी
 Čeština
 Українська
 Română

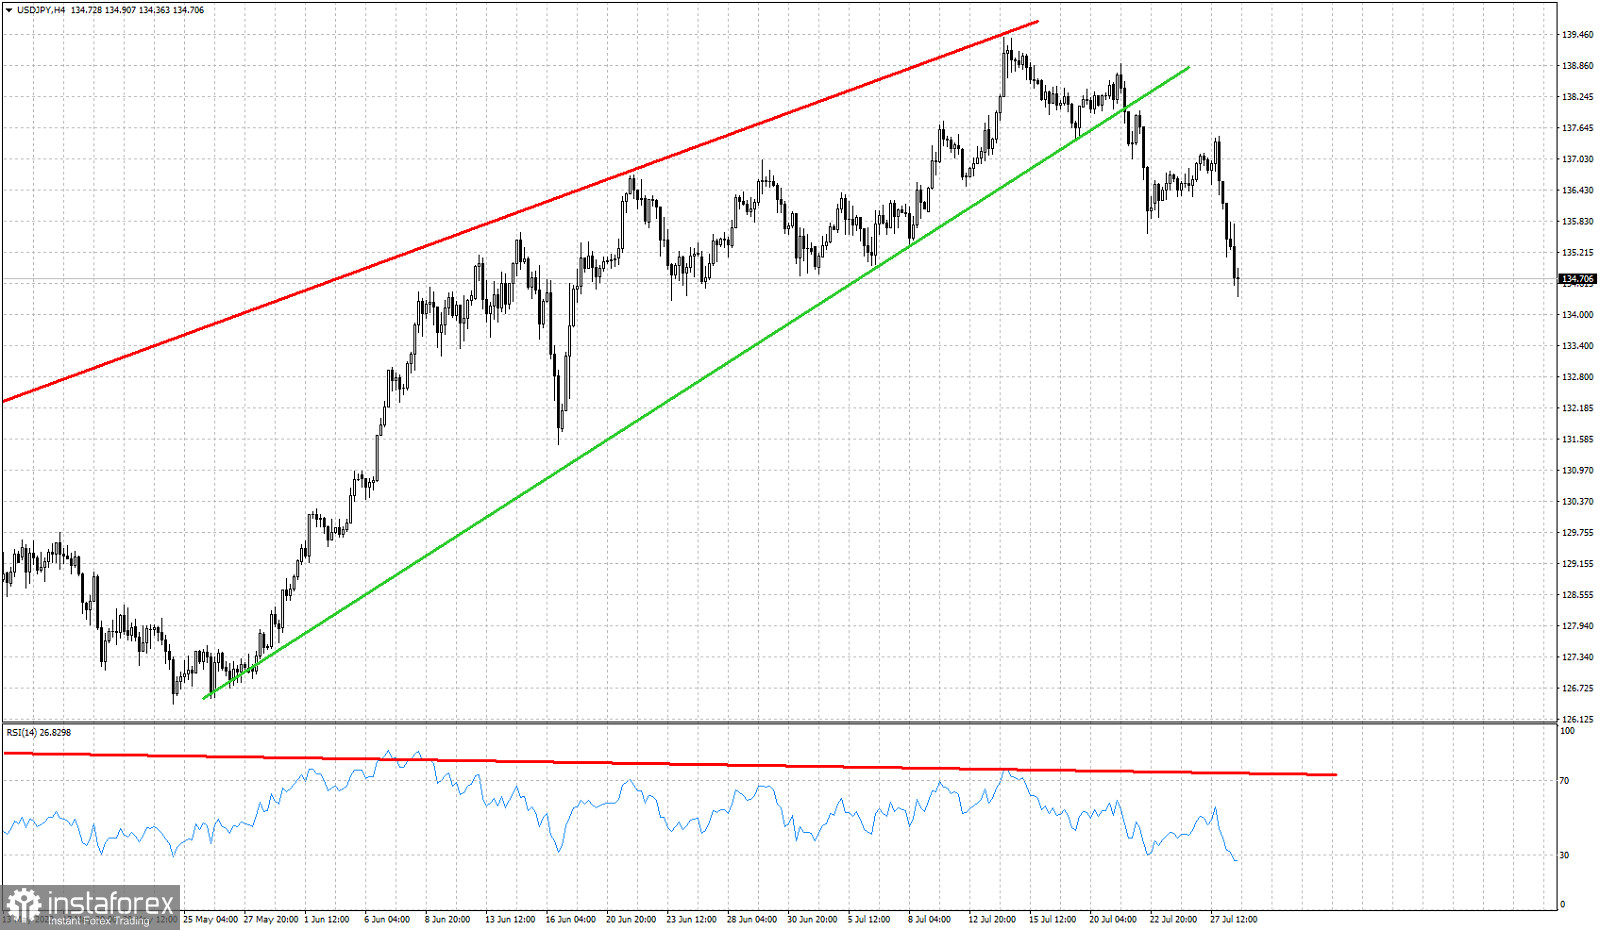
Red lines- bearish RSI divergence
Green line - support trend line
In previous posts we warned the imminent reversal in USDJPY, but we also noted the bearish signal given at 137.80 once the wedge pattern was broken downwards. Price has now started making lower lows and lower highs. USDJPY is approaching our first short-term pull back target of 134 where horizontal support by previous lows is found. For a second consecutive week USDJPY is under pressure after the break below the green support trend line. The monthly chart is more worrying. Why?
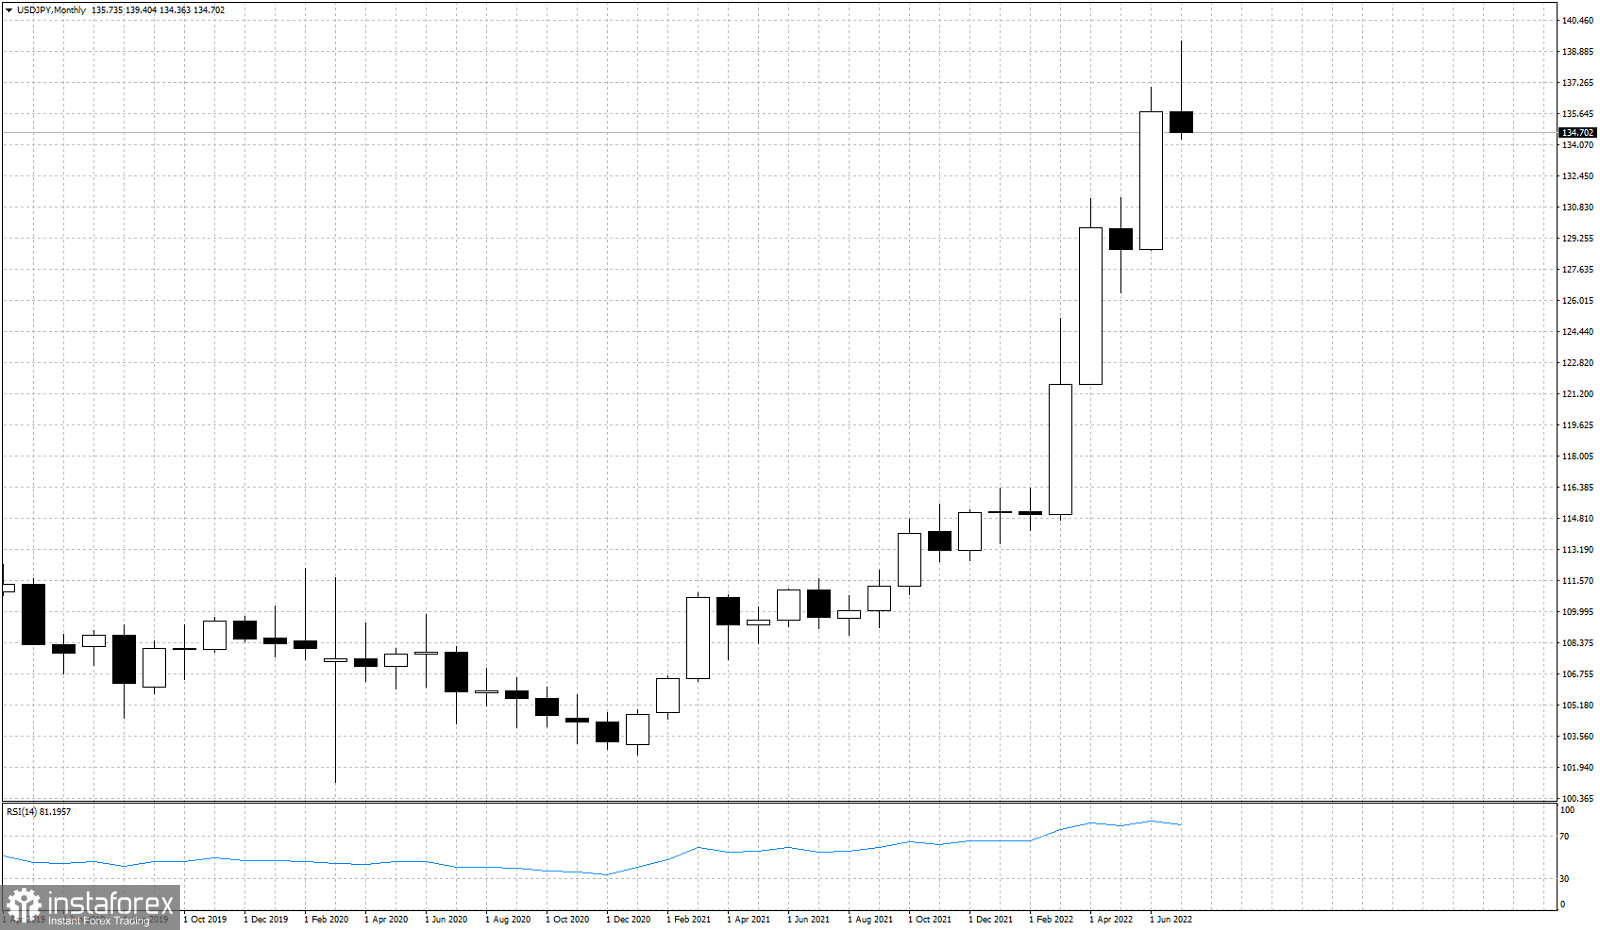
On a monthly basis with only one more trading session left to end the month, USDJPY has formed a bearish reversal candlestick pattern. If August forms a bearish candlestick, then we will be talking about a major top and the start of a big reversal. We have mentioned many times before that a back test of the neckline resistance, now support, at 126 is justified at Head and Shoulder patterns.