 English
  Русский
 Bahasa Indonesia
 Bahasa Malay
 ไทย
ไทย Español
 Deutsch
 Български
 Français
 Tiếng Việt
 中文
中文 বাংলা
বাংলা हिन्दी
 Čeština
 Українська
 Română

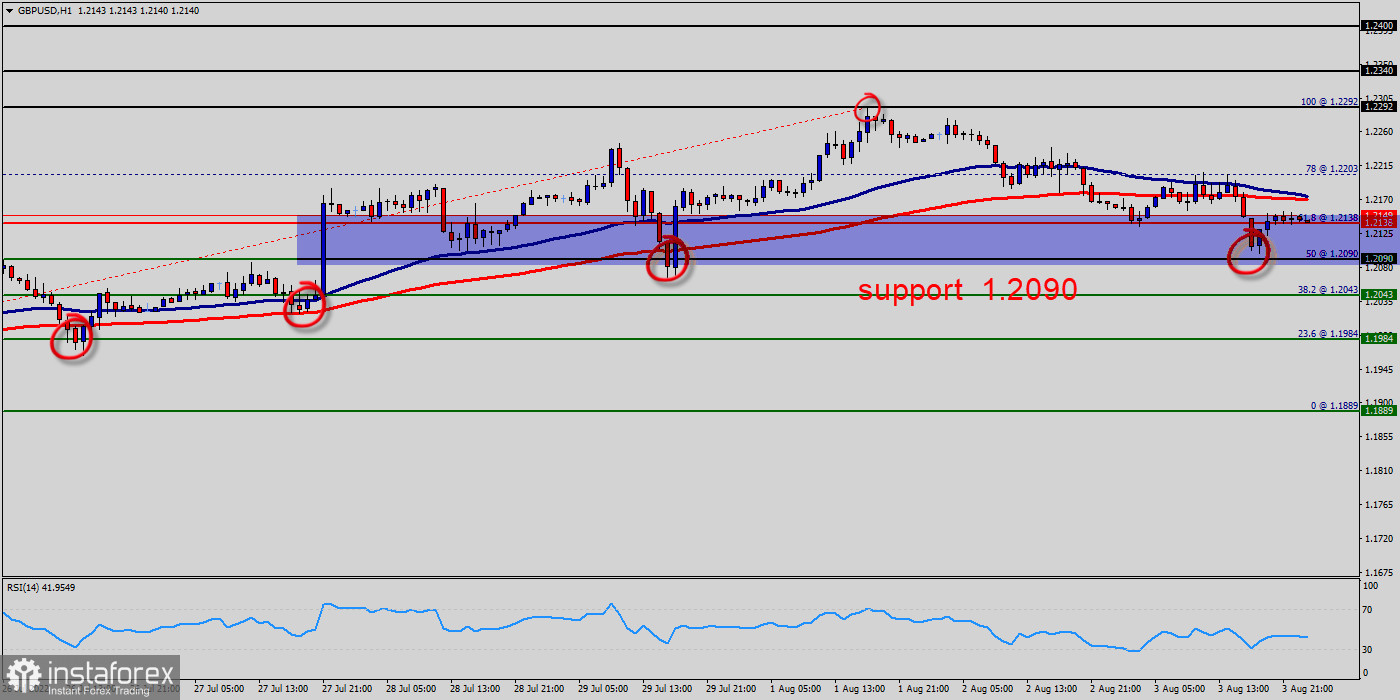
The GBP/USD pair broke resistance which turned to strong support at the level of 1.2090 last week.
The level of 1.2090 coincides with 50% of Fibonacci, which is expected to act as major support today.
Since the trend is above the 50% Fibonacci level, the market is still in an uptrend. From this point, the GBP/USDpair is continuing in a bullish trend from the new support of 1.2090.
Currently, the price is in a bullish channel. According to the previous events, we expect the GBP/USD pair to move between 1.2090 and 1.2292 (+202 point
On the H1 chart, resistance is seen at the levels of 1.2203 and 1.2292. Also, it should be noticed that, the level of 1.2138 represents the daily pivot point.
Therefore, strong support will be formed at the level of 1.2138 providing a clear signal to buy with the targets seen at 1.2138. If the trend breaks the support at 1.2203 (first resistance) the pair will move upwards continuing the development of the bullish trend to the level 1.2292 in order to test the daily resistance 2.
However, the stop loss should always be taken into account, for that it will be reasonable to set your stop loss at the level of 1.2043.