 English
  Русский
 Bahasa Indonesia
 Bahasa Malay
 ไทย
ไทย Español
 Deutsch
 Български
 Français
 Tiếng Việt
 中文
中文 বাংলা
বাংলা हिन्दी
 Čeština
 Українська
 Română

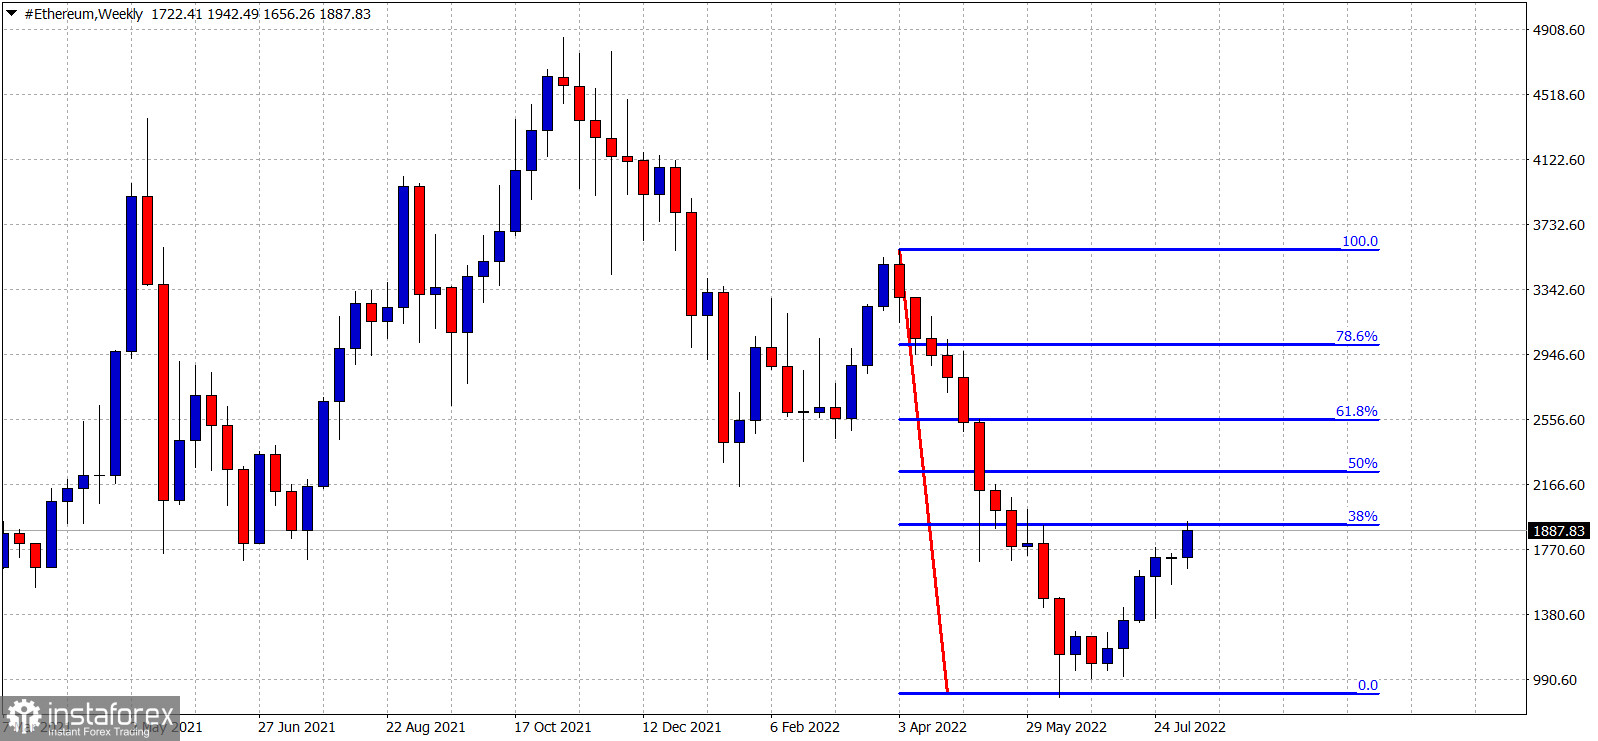
Blue lines- Fibonacci retracements
Ethereum reached the $1,900 level as expected by our recent analysis since price respected the bullish channel it was in. Price continues making higher highs and higher lows. Price has reached the 38% Fibonacci retracement of the decline from $3,579. This is important short-term resistance. Big test ahead for Ethereum bulls.