 English
  Русский
 Bahasa Indonesia
 Bahasa Malay
 ไทย
ไทย Español
 Deutsch
 Български
 Français
 Tiếng Việt
 中文
中文 বাংলা
বাংলা हिन्दी
 Čeština
 Українська
 Română

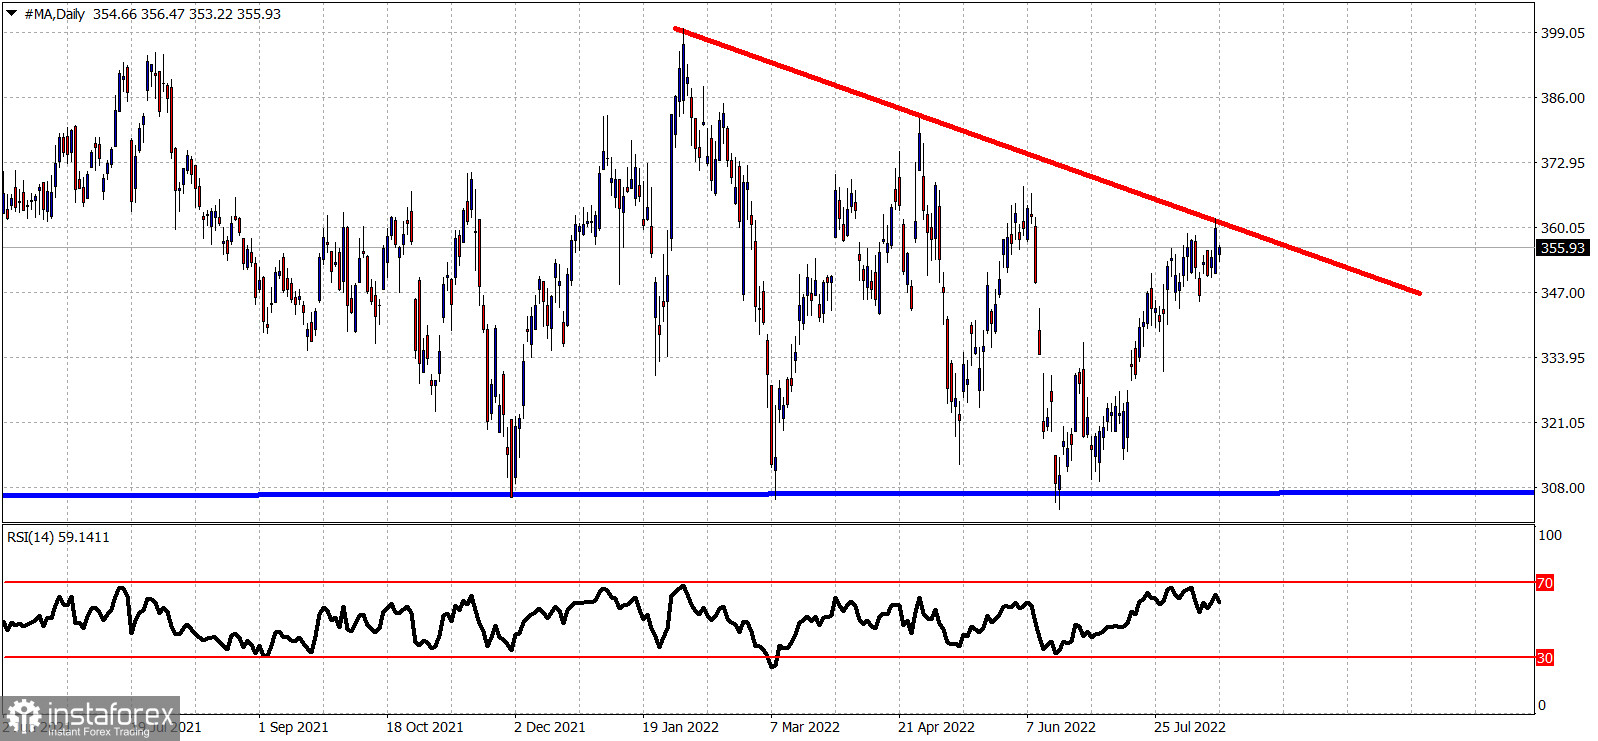
Red line -resistance
Blue line- horizontal support
MA stock price has reached the resistance area around $360 as expected by our earlier analysis at the end of July. Price is testing the upper part of the descending triangle pattern. This is major resistance. The RSI is making lower highs as price is making higher highs. There are increased chances we see another rejection at current levels or a little bit higher. There are increased chances we see another downward move towards $306. Bulls need to be very cautious. Support is at $346. A break below this level will increase chances of a move lower towards $300.