 English
  Русский
 Bahasa Indonesia
 Bahasa Malay
 ไทย
ไทย Español
 Deutsch
 Български
 Français
 Tiếng Việt
 中文
中文 বাংলা
বাংলা हिन्दी
 Čeština
 Українська
 Română

 and drag the price through the 104.30 initial support in the next few trading sessions. Only a break higher will delay matters further.
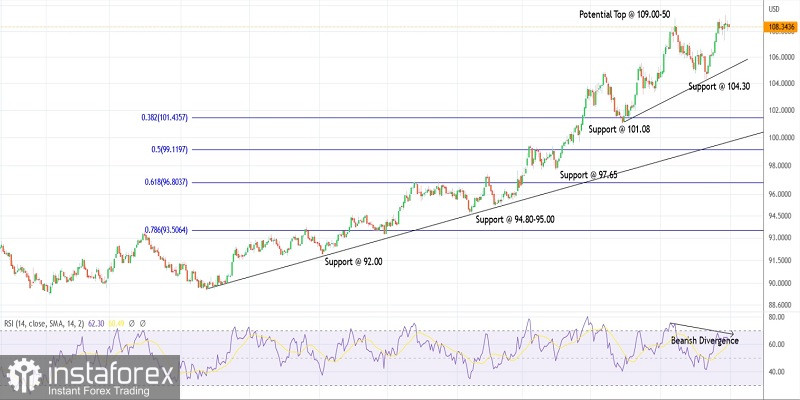
The US dollar index has carved a meaningful larger-degree upswing between 89.50 and 109.21 as seen on the daily chart here. The bears are now looking poised to retrace the upper border and drag prices through 101.00 at least, which is the Fibonacci 0.382 level of the above rally. The bulls might resume higher thereafter.
The trading instrument has also carved a strong bearish divergence on the daily RSI as prices climbed above 109.21 earlier this week. This is also a good indicator for a potential trend reversal, which could drag prices lower towards 104.30 at least. Only a break above 109.21 would delay matters further and bring back the bulls into play.
Trading plan:
Potential drop to 104.30 against 109.21
Good luck!