 English
  Русский
 Bahasa Indonesia
 Bahasa Malay
 ไทย
ไทย Español
 Deutsch
 Български
 Français
 Tiếng Việt
 中文
中文 বাংলা
বাংলা हिन्दी
 Čeština
 Українська
 Română

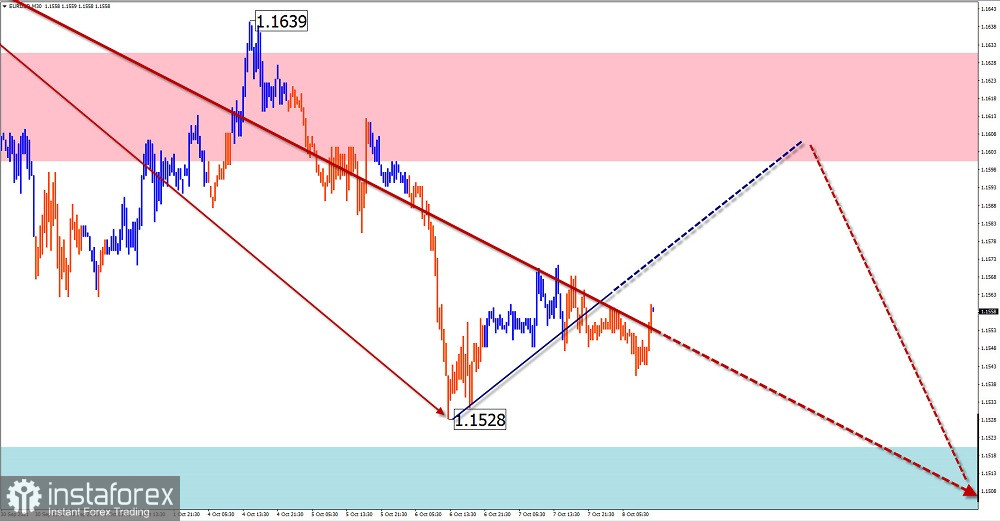
EUR/USD
Analysis:
The main pair of the European currency market has been dominated by an upward trend since March last year. The price has been adjusted downwards for the entire current year. Moreover, the wave structure looks complete. Quotes are at the lower border of a strong potential reversal zone. There are no reversal signals yet.
Forecast:
The general flat nature of price fluctuations is expected today. A short-term depreciation of the exchange rate is possible in the next session, no further than the support zone. By the end of the day, the probability of price growth increases.
Potential reversal zones
Resistance:
- 1.1600/1.1530
Support:
- 1.1520/1.1490
Recommendations:
The upcoming rise goes against the trend of movement, so buying the euro today may be risky. It is better to split the lot in them. It is optimal to refrain from entering the pair's market until the price pullback is completed, tracking the signals for the sale of the instrument.
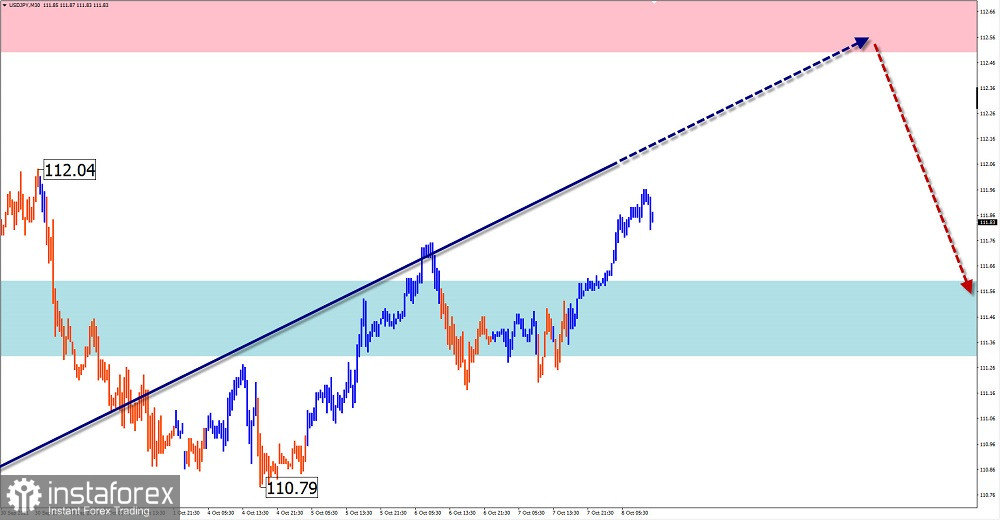
USD/JPY
Analysis:
The price on the daily TF chart of the Japanese yen has been forming a downward correction wave since March of this year. By the current day, it looks like a shifting plane. Its structure lacks the final part. The price is approaching the lower boundary of the resistance zone of the W1 scale.
Forecast:
On the next day, the price of the pair is expected to move with an upward vector. Settlement zones indicate the boundaries of the price corridor. By the end of the day, the probability of a change of course and the beginning of a decline increases.
Potential reversal zones
Resistance:
- 112.50/112.80
Support:
- 111.60/111.30
Recommendations:
Trading the Japanese yen today can be safe only within the intraday, a fractional lot. Until clear reversal signals appear in the area of the resistance zone, sales are not recommended.
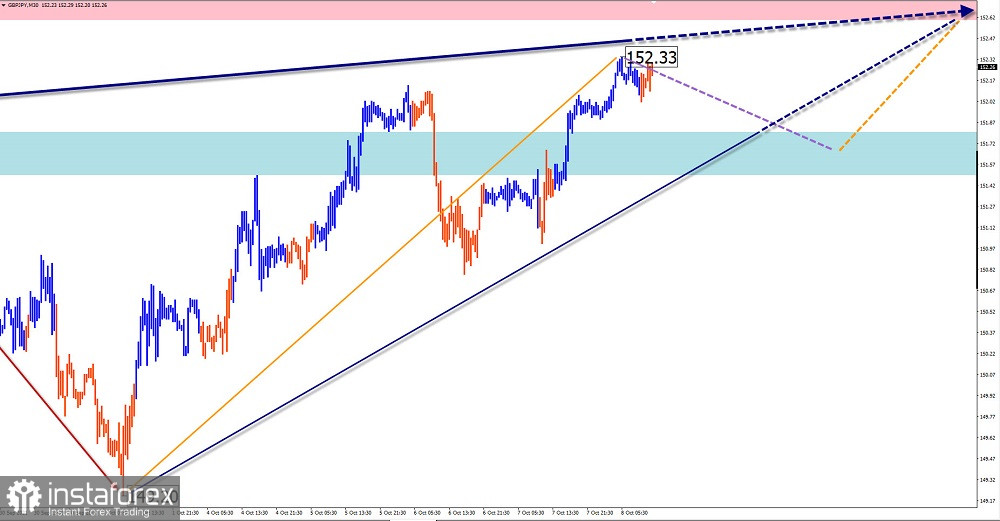
GBP/JPY
Analysis:
The main direction of movement of the pound/yen pair has been set by bullish momentum since last year. The unfinished trend section has been counting since September 21. The structure of this wave lacks the final ascending segment.
Forecast:
There is a high probability of the pair's movement moving into the lateral plane in the coming day, with a decrease to the calculated support zone. At the end of the day or tomorrow, you can expect an increase in volatility, a reversal, and the beginning of price growth.
Potential reversal zones
Resistance:
- 152.60/152.90
Support:
- 151.80/151.50
Recommendations:
Until the full end of the upcoming rollback, trading on the pair's market may be unprofitable and is not recommended. In the area of settlement support, it is proposed to track signals for buying a pair.
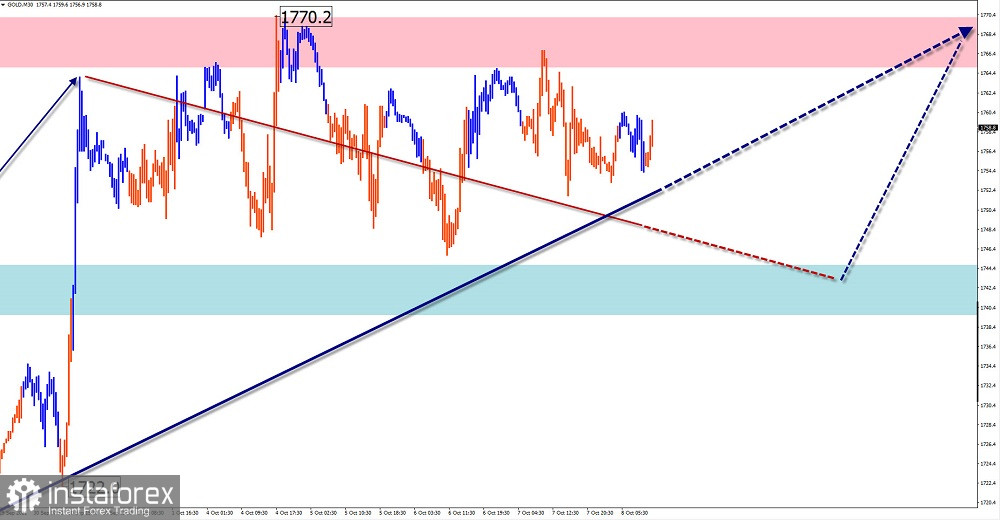
GOLD
Analysis:
Since August 9, gold quotes have been forming an upward wave of the daily scale of the chart. The price rise that began on September 29 completed the middle part of the current wave (B). Over the past decade, the price has moved in a sideways price corridor, preparing the ground for a further upward leap.
Forecast:
Today, the continuation of "sideways" is expected. A downward vector is more likely within the boundaries of the corridor in the first half of the day. A reversal and the beginning of price growth are expected by the end of the day, up to the resistance zone.
Potential reversal zones
Resistance:
- 1765.0/1770.0
Support:
- 1745.0/1740.0
Recommendations:
In the coming day, gold sales may be unprofitable. The support zone shows the safest area to buy the instrument.
Explanations: In the simplified wave analysis (UVA), waves consist of 3 parts (A-B-C). The last incomplete wave is analyzed. The solid background of the arrows shows the formed structure, and the dotted one shows the expected movements.
Attention: The wave algorithm does not take into account the duration of the instrument's movements in time!