 English
  Русский
 Bahasa Indonesia
 Bahasa Malay
 ไทย
ไทย Español
 Deutsch
 Български
 Français
 Tiếng Việt
 中文
中文 বাংলা
বাংলা हिन्दी
 Čeština
 Українська
 Română

Here are the details of the economic calendar for October 12:
Yesterday, the UK's labor market data was released, where the indicators turned out to be quite good. But despite the fact that the unemployment rate coincided with the forecast, it is still decreasing from 4.6% to 4.5%. In turn, employment in the country increased by 235 thousand against 183 thousand in the previous reporting period.
The pound sterling ignored the statistics as if they didn't exist.
During the US trading session, America's data on open vacancies were published, which declined by 659 thousand. It did not have much influence since there is nothing surprising in the reduction in the number of open vacancies after the decline in the unemployment rate.
Analysis of trading charts from October 12:
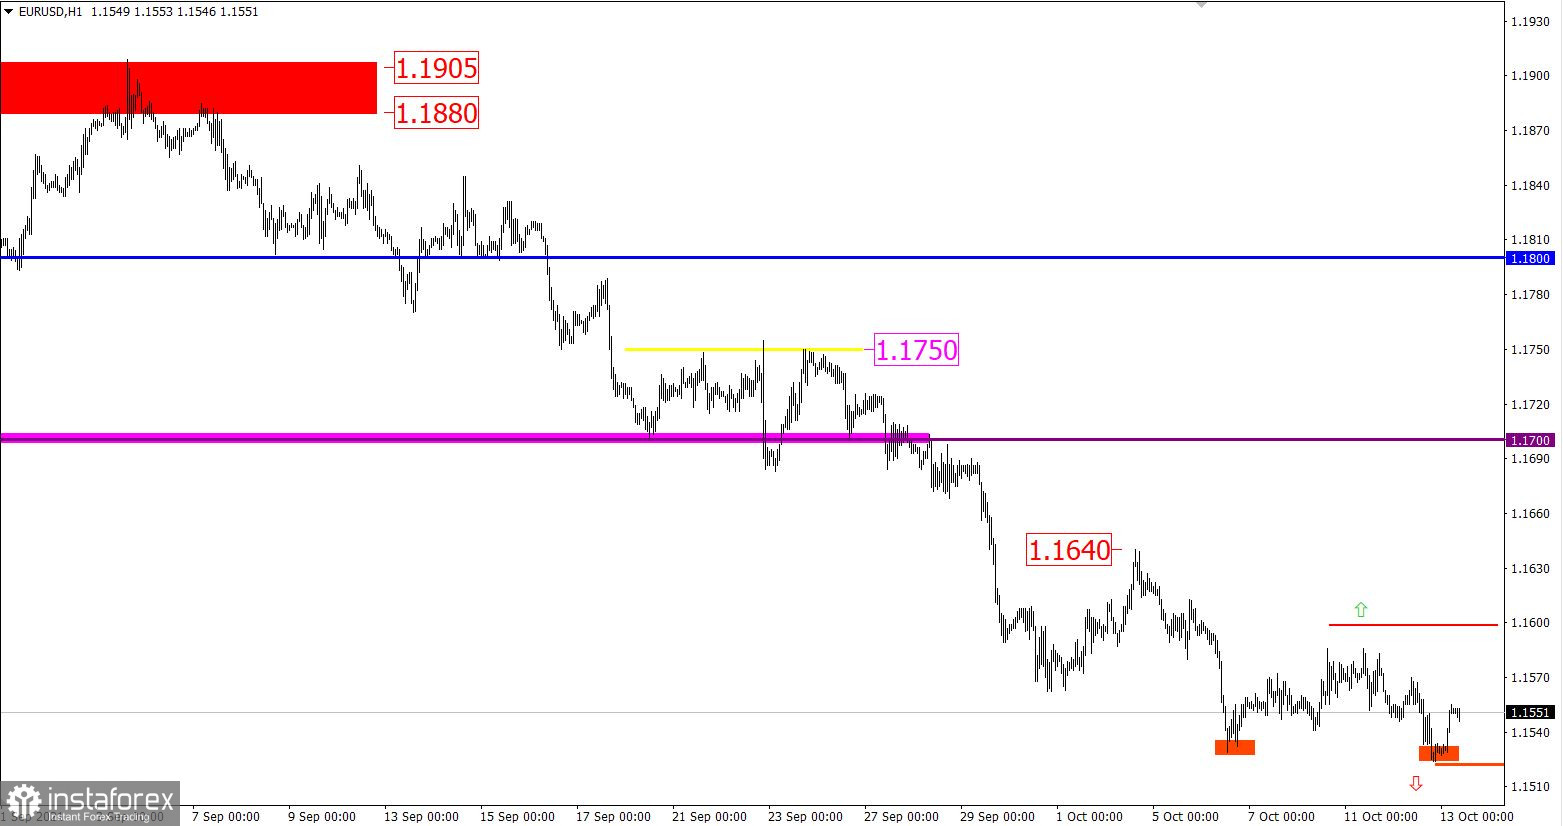
The EUR/USD pair was able to update the local low (1.1529) of October 6, but the quote did not manage to stay below it. As a result, the volume of short positions fell and the price pulled back.
Here, the most important thing is that the downward interest is still relevant among market participants, despite the high level of oversold of the European currency. Since the beginning of autumn, the euro has lost more than 3% of its value against the US dollar.
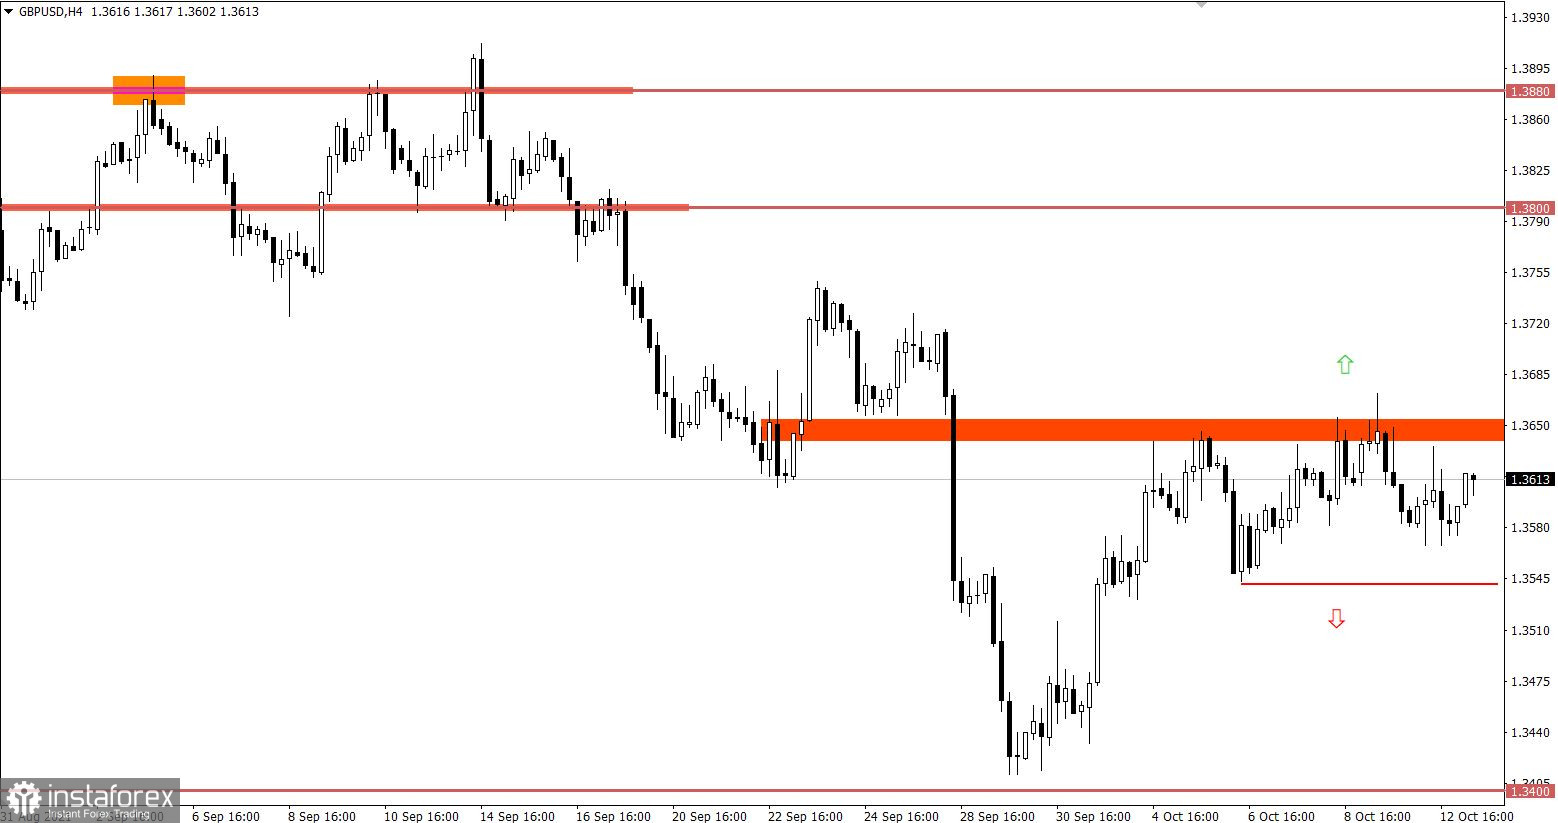
The GBP/USD pair changed its correctional course to a sideways one, where it has been moving in the range of 1.3540/1.3670 for a week. A consistent rebound from the set borders indicates the process of accumulation of trade forces, which will ultimately lead to a new round of acceleration.
In simple words, traders, being in a sideways range, consider trading not within the borders, but beyond it. At this point, the highest speculative interest will arise.
Short positions or Short means sell positions.* Oversold market – a situation where prices have dropped too low and quickly. In this case, we are talking about the euro, which has weakened against the dollar by more than 3% since the beginning of autumn.
* The accumulation process is price fluctuations in a closed amplitude, where at the moment of the breakdown of a particular stagnation boundary, a local acceleration towards breakdown often occurs.

October 13 economic calendar:
This morning, the UK has released its data on industrial production, the growth rate of which slowed from 3.8% to 3.7%. In monthly terms, the indicator rose by 0.8%.
The statistics from Britain were good, but as usual, the market ignored them.
The main event will be the publication of US inflation data. It is predicted that the growth rate of consumer prices may accelerate from 5.3% to 5.4%.
Trading plan for EUR/USD on October 13:
Despite the technical pullback, the downward cycle is considered the main direction in the market. Therefore, a return of the price below the level of 1.1520 will highly likely lead to the strengthening of short positions. This movement will open the way towards the support level of 1.1420.
If we consider the scenario of a major correction, which has not happened for a long time, then the quote needs to stay above the 1.1600 level first. This will probably open the way to a local high on October 4.
Trading plan for GBP/USD on October 13:
A prolonged stay of the price in the lateral amplitude will eventually lead to a natural acceleration if one or another border of the established stagnation is broken.
In the event that expectations coincide, the most appropriate trading tactic is the breakdown method.
Trading recommendations:
Buy positions can be considered if the price is kept above the level of 1.3680.
Sell positions can be considered if the price is kept below the level of 1.3640.
What is reflected in the trading charts?
A candlestick chart view is graphical rectangles of white and black light, with sticks on top and bottom. When analyzing each candle in detail, you will see its characteristics of a relative period: the opening price, closing price, and maximum and minimum prices.
Horizontal levels are price coordinates, relative to which a stop or a price reversal may occur. These levels are called support and resistance in the market.
Circles and rectangles are highlighted examples where the price of the story unfolded. This color selection indicates horizontal lines that may put pressure on the quote in the future.
The up/down arrows are the reference points of the possible price direction in the future.