 English
  Русский
 Bahasa Indonesia
 Bahasa Malay
 ไทย
ไทย Español
 Deutsch
 Български
 Français
 Tiếng Việt
 中文
中文 বাংলা
বাংলা हिन्दी
 Čeština
 Українська
 Română

Trend analysis (Fig. 1)
EUR / USD may climb from 1.1595 (closing of yesterday's daily candle) to the upper fractal (daily candle from 10/14/2021) - 1.1624, followed by another increase to the 38.2% retracement level (yellow dashed line) - 1.1671.
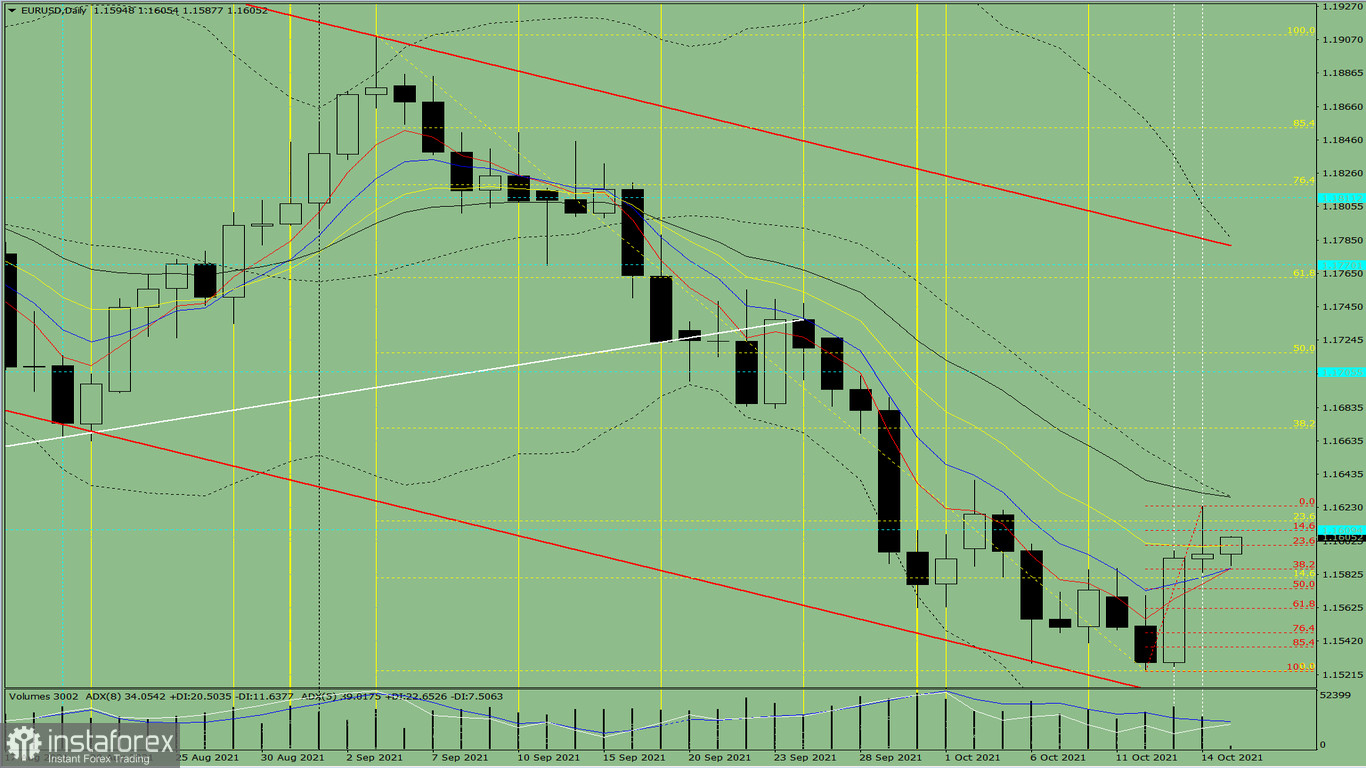
Fig. 1 (daily chart)
Comprehensive analysis:
- Indicator analysis - up;
- Fibonacci levels - up;
- Volumes - up;
- Candlestick analysis - up;
- Trend analysis - up;
- Bollinger bands - down;
- Weekly chart - up.
General conclusion: EUR/USD may rise today from 1.1595 (closing of yesterday's daily candle) to the upper fractal - 1.1624 (daily candle from 10/14/2021), and then climb to the 38.2% retracement level (yellow dashed line) - 1.1671.
Unlikely scenario: EUR/USD will drop from 1.1595 (closing of yesterday's daily candle) to the 50.0% retracement level (red dotted line) - 1.1574, and then rise to the upper fractal (red dotted line) - 1.1624.