 English
  Русский
 Bahasa Indonesia
 Bahasa Malay
 ไทย
ไทย Español
 Deutsch
 Български
 Français
 Tiếng Việt
 中文
中文 বাংলা
বাংলা हिन्दी
 Čeština
 Українська
 Română

Trend analysis (Fig. 1)
Today, the price from the level of 1.3668 (closing of yesterday's daily candle) will attempt to rise to the target of 1.3719 – the pullback level of 61.8% (yellow dotted line). Once this line is tested, it may further rise to the target of 1.3792 – the pullback level of 74.6% (yellow dotted line).
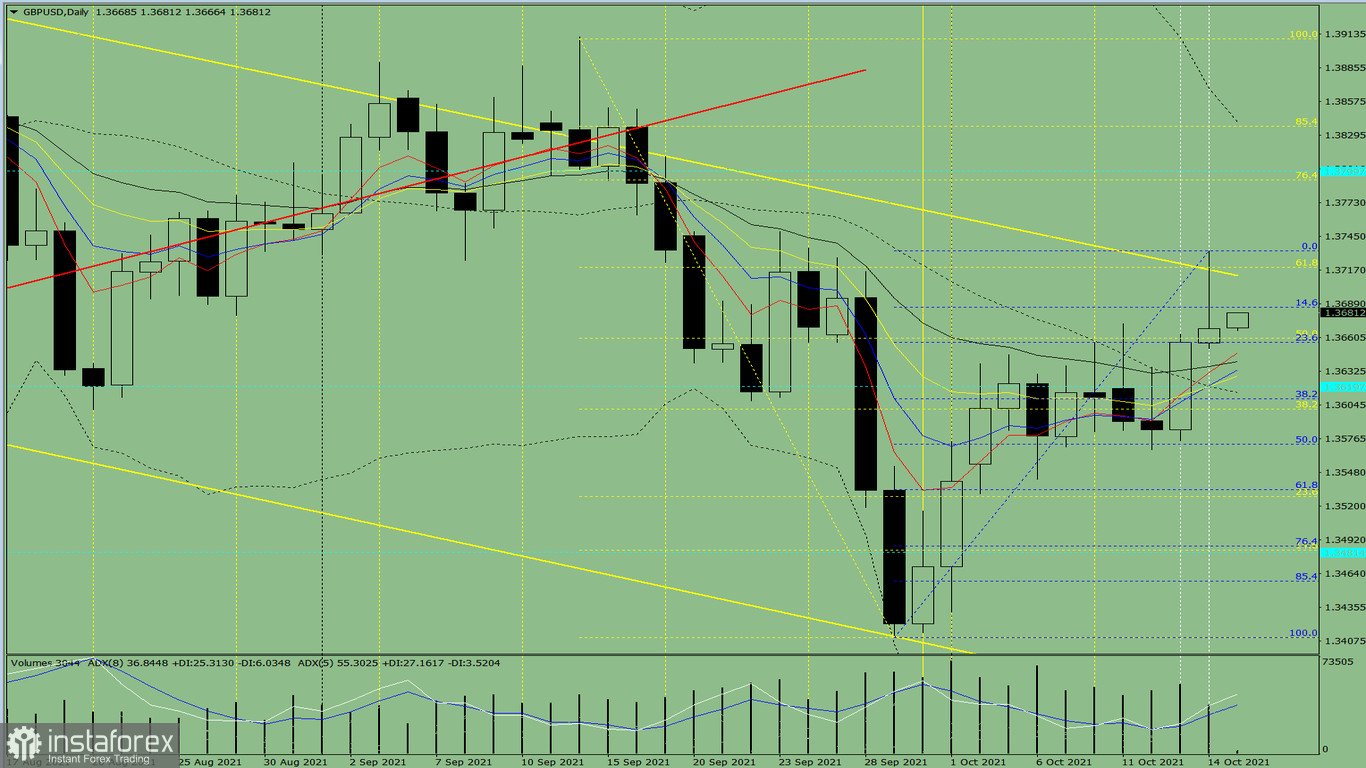
Figure 1 (daily chart)
Comprehensive analysis:
- Indicator analysis - up
- Fibonacci levels - up
- Volumes - up
- Candlestick analysis - up
- Trend analysis - up
- Bollinger lines - up
- Weekly chart - up
General conclusion:
The price from the level of 1.3668 (closing of yesterday's daily candle) is expected to move up to the target of 1.3719 – the pullback level of 61.8% (yellow dotted line) today. After testing this line, the upward movement may continue to the target of 1.3792 – the pullback level of 74.6% (yellow dotted line).
Alternatively, the price from the level of 1.3668 (closing of yesterday's daily candle) may try rising to the target of 1.3712 – the resistance line (yellow bold line). After testing it, the price may start declining to the target of 1.3656 – the pullback level of 23.6% (blue dotted line).