 English
  Русский
 Bahasa Indonesia
 Bahasa Malay
 ไทย
ไทย Español
 Deutsch
 Български
 Français
 Tiếng Việt
 中文
中文 বাংলা
বাংলা हिन्दी
 Čeština
 Українська
 Română

Wave pattern
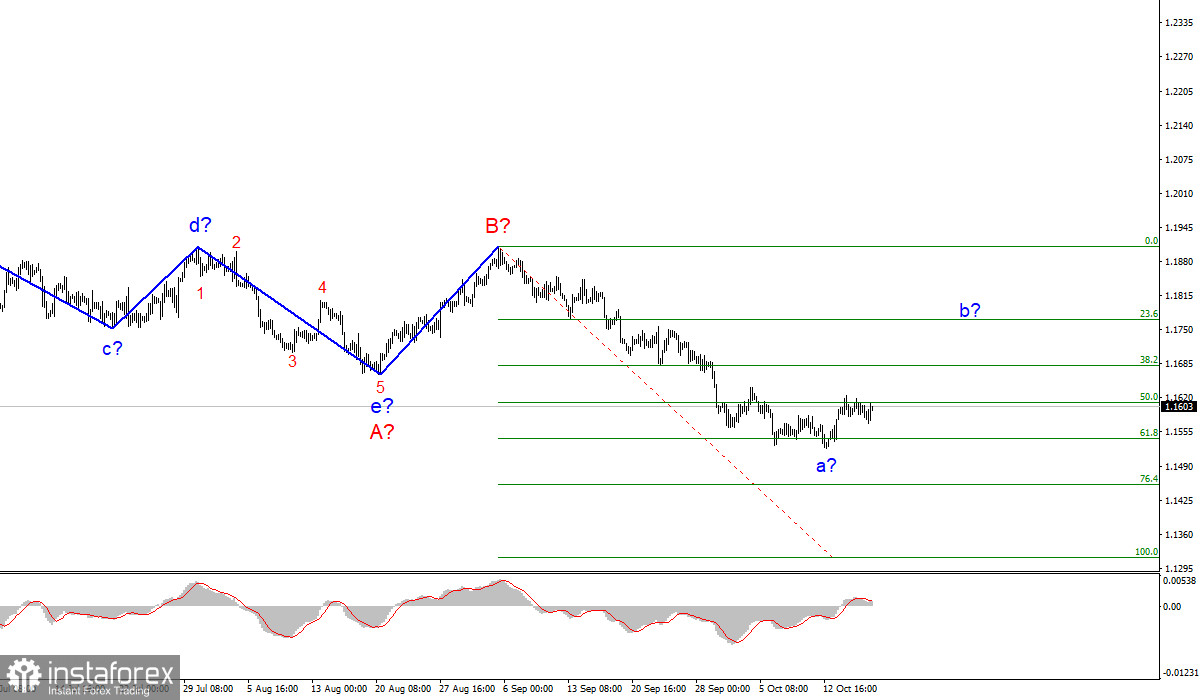
The wave counting of the 4-hour chart for the Euro/Dollar instrument suffered certain changes after the quotes fell below the low of the previous wave. Thus, now the a-b-c-d-e trend segment, which has been formed since the beginning of the year, is interpreted as wave A, and the subsequent increase in the instrument is interpreted as wave B. If this assumption is correct, then the construction of the proposed wave C has now begun and is continuing, which can take a very extended form. Its internal supposed wave a has completed its construction and received a very extended form. At this time, the construction of the corrective wave b has begun, after the completion of which at least one more downward wave should be built. Thus, the current wave counting does not indicate that the reduction of the instrument is completed. At the same time, corrective structures are very problematic, since at any moment they can become more complicated or take on a not quite standard form.
The news background was quite weak on Monday. US Industrial production in September decreased by 1.3% MoM (markets expected an increase of 0.3% MoM). Despite this, no changes in the dynamics of the instrument were noticed. At the time of the report's release, the quotes were slightly rising after falling at the same rate (30 pips). And the production report had no effect on the mood of the markets. The amplitude remains very weak. Wave b can be built at this rate for several weeks.
The markets are not paying attention to much more significant events at present, as evidenced by the weakest amplitude of the instrument. Perhaps, this will change upon the decision of the Fed on the tapering of the QE program. Note that the latest inflation report increase to 5.4% YoY. Accordingly, there is a high probability that the Fed will decide to gradually reduce the volume of QE in order to stop the further growth of the consumer price index. A reduction in QE may cause a new decrease in the instrument, which may just coincide with the need to build a wave c in C.
General conclusions
Based on the analysis, I conclude that the construction of the downward wave C will continue, but at this time the corrective wave has begun. Therefore, now I advise you to wait for the completion of this wave, and after that - sell the instrument for each downward signal from the MACD, with targets located near the calculated marks of 1.1454 and 1.1314, which corresponds to 76.4% and 100.0% Fibonacci levels.
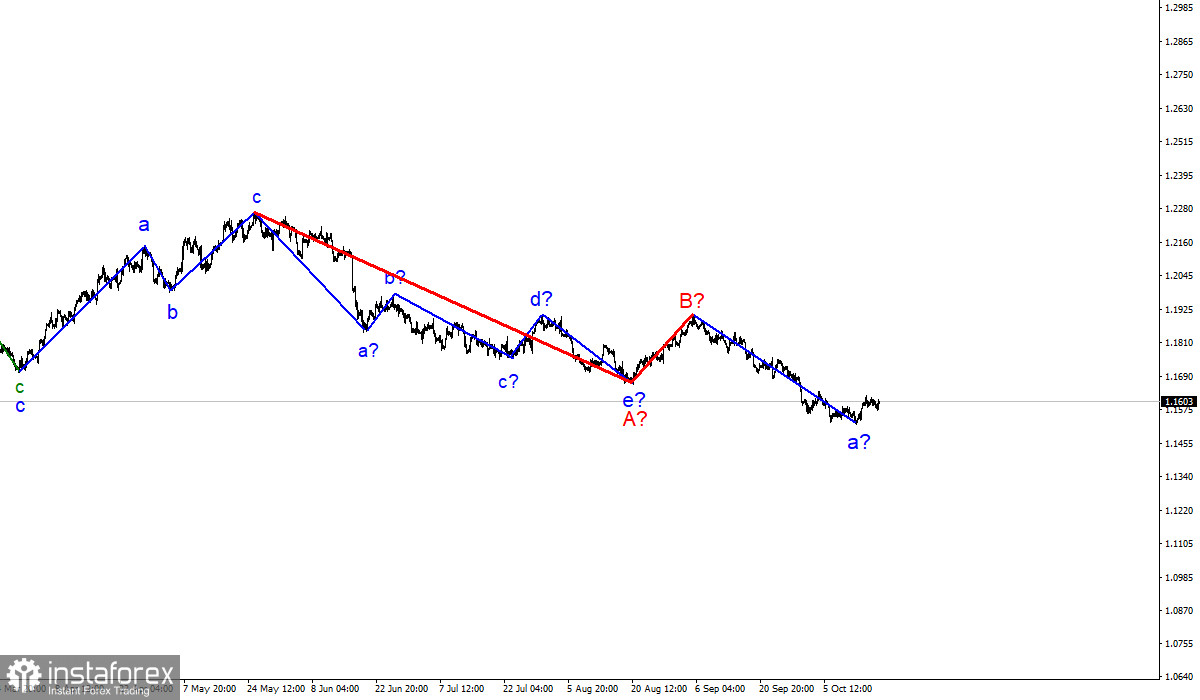
The wave counting of the higher scale looks quite convincing. The decline in quotes continues and now the downward section of the trend, which originates on May 25, takes the form of a three-wave corrective structure A-B-C. Thus, the decline may continue for several more months until wave C is fully completed.