 English
  Русский
 Bahasa Indonesia
 Bahasa Malay
 ไทย
ไทย Español
 Deutsch
 Български
 Français
 Tiếng Việt
 中文
中文 বাংলা
বাংলা हिन्दी
 Čeština
 Українська
 Română

Here are the details of the economic calendar for October 18:
The data on industrial production in the United States was published yesterday, where their volume declined from 5.6% to 4.8% in annual terms. The change is quite strong, given that the previous data was revised in favor of a decline from 5.9% to 5.6%, and the current figure was several times worse than the forecast of 5.8%.
Industrial production reflects the change in production volumes at enterprises in the reporting period. The calculation of the indicator takes into account all branches of production: industry, mining, and processing of minerals, energy production, water resources, and waste management.
The reaction of the market to the US data was in terms of weakening dollar positions.
Analysis of trading charts from October 18:
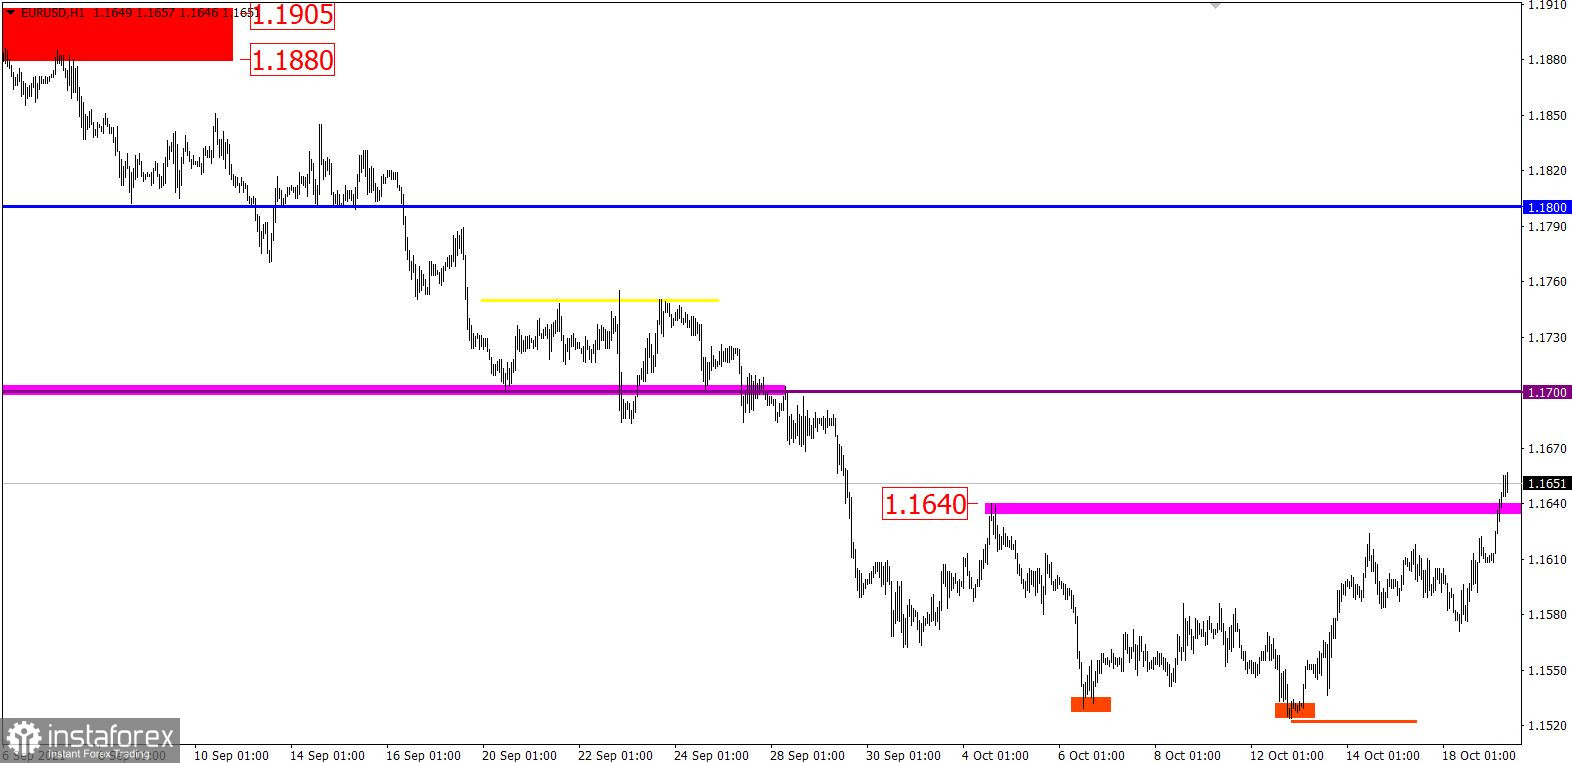
The EUR/USD pair failed to complete the corrective move previously set in the market. The quote temporarily plunged to the level of 1.1571, but then returned to the cycle of the upward movement.
In the previous review, a downward scenario was considered, but the signal to sell the euro should emerge only when the price was kept below the level of 1.1565, which did not happen.
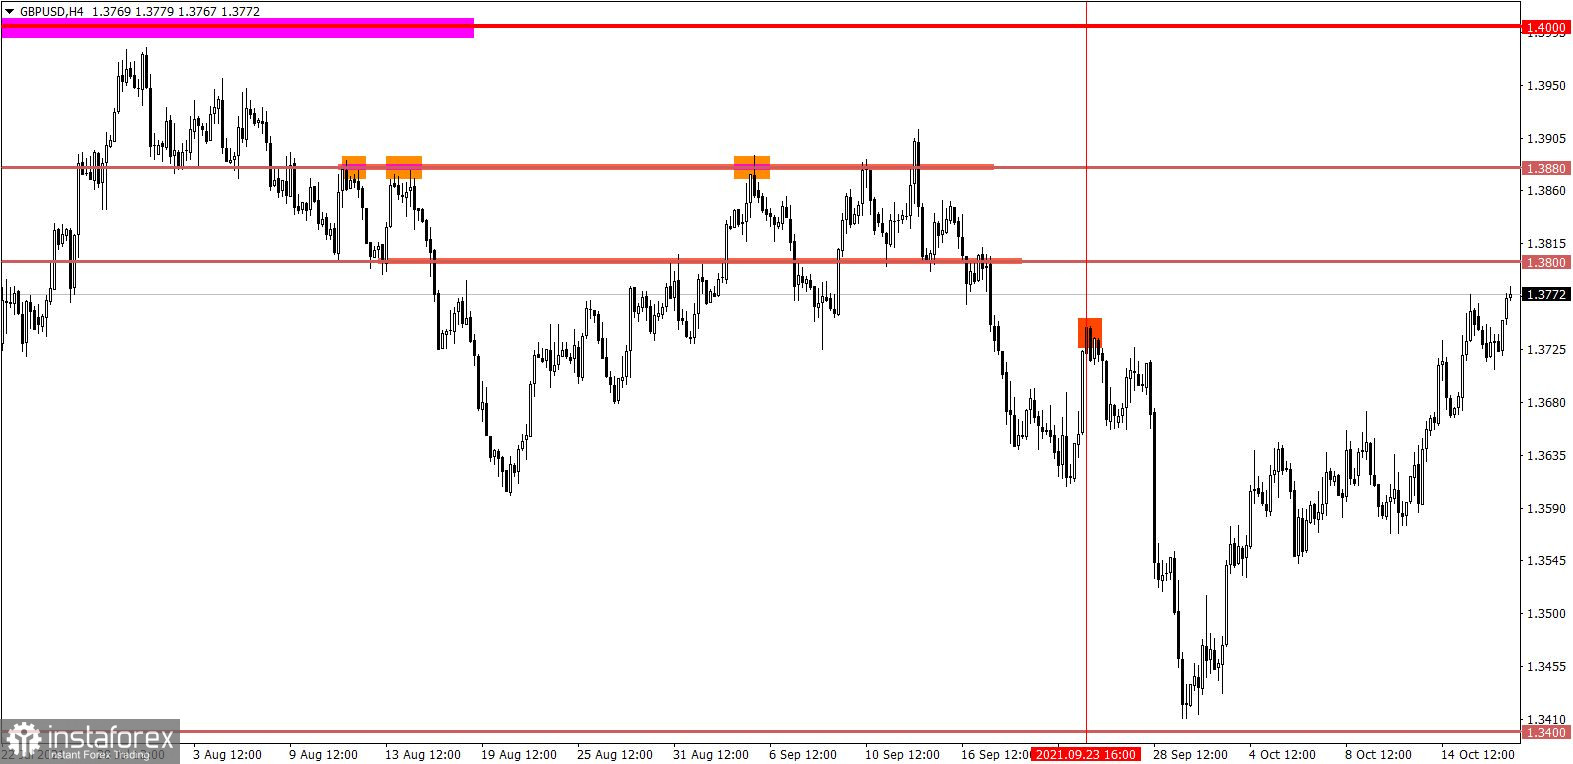
The GBP/USD pair slowed down the upward movement in the local high area of September 23, where there was a pullback towards the level of 1.3708. The volume of short positions is clearly insufficient to resume the downward cycle. Therefore, the quote returned to the maximum correction level after a small pullback.
The trading plan on October 18 considered the possibility of a gradual weakening of the pound sterling if the price is kept below the level of 1.3700. The signal was not confirmed.

October 19 economic calendar:
Today, American data on the real estate market is expected to be published, where it is predicted that the construction of new homes, as well as the number of construction permits issued, will decrease in September. This is not the best signal for the US real estate market.
Trading plan for EUR/USD on October 19:
There was a high demand for long positions in the euro during the start of the Asian session. This led to an update of the local high (1.1640) of October 4. It should be noted that holding the price above the level of 1.1660 will most likely lead to a subsequent growth towards the level of 1.1700.
Otherwise, the quote will return to the range of 1.1620.
Trading plan for GBP/USD on October 19:
It can be assumed that the subsequent resistance level is around 1.3800/1.3830. It is possible to reduce the volume of long positions within these levels, which will lead to another attempt to end the correction.
What is reflected in the trading charts?
A candlestick chart view is graphical rectangles of white and black light, with sticks on top and bottom. When analyzing each candle in detail, you will see its characteristics of a relative period: the opening price, closing price, and maximum and minimum prices.
Horizontal levels are price coordinates, relative to which a stop or a price reversal may occur. These levels are called support and resistance in the market.
Circles and rectangles are highlighted examples where the price of the story unfolded. This color selection indicates horizontal lines that may put pressure on the quote in the future.
The up/down arrows are the reference points of the possible price direction in the future.