 English
  Русский
 Bahasa Indonesia
 Bahasa Malay
 ไทย
ไทย Español
 Deutsch
 Български
 Français
 Tiếng Việt
 中文
中文 বাংলা
বাংলা हिन्दी
 Čeština
 Українська
 Română

EUR/USD
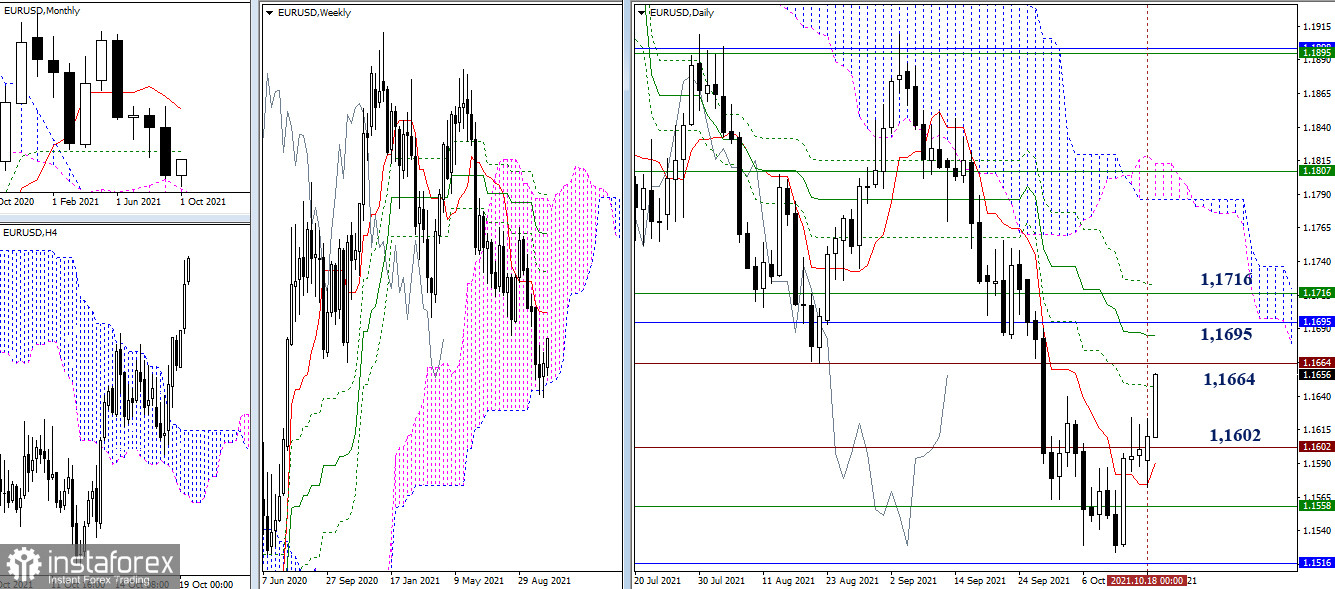
The daily short-term trend (1.1574) managed to help the bulls to keep their positions yesterday. At the same time, they were able to close the day above the resistance level of 1.1602. As a result, active growth is observed today. The euro has already started testing the nearest resistance levels of 1.1647-64 (daily Fibo Kijun + historical level). The breakdown of which will allow us to focus on the bullish interests on the next resistance zone, led by the levels of 1.1695 (monthly Fibo Kijun) and 1.1716 (weekly Tenkan).
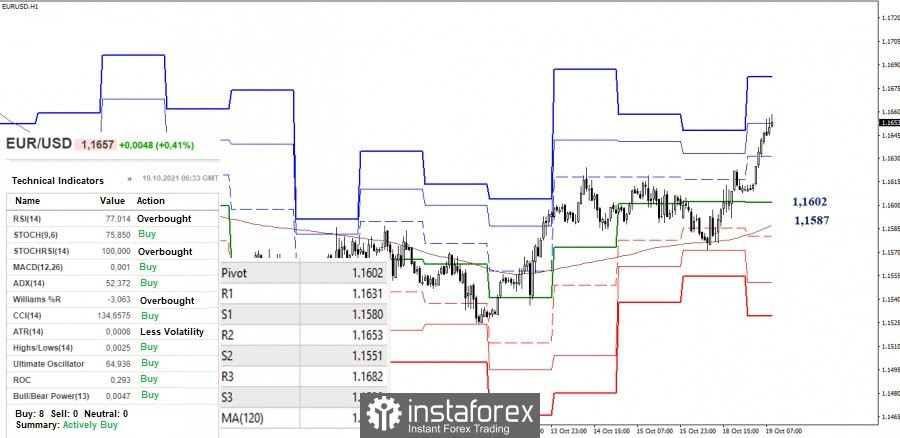
Yesterday, the support level of the weekly long-term trend coped with the task. Due to this support, the bulls are still in favor in the smaller timeframes. They continue their upward movement today, currently testing the resistance of 1.1653 (R2). The next intraday upward target is 1.1682 (R3 classic pivot levels). Currently, the key H1 levels continue to act as support levels. If a decline occurs, they will protect the bullish interests at the borders of 1.1602 - 1.1587 (central pivot level + weekly long-term trend).
GBP/USD
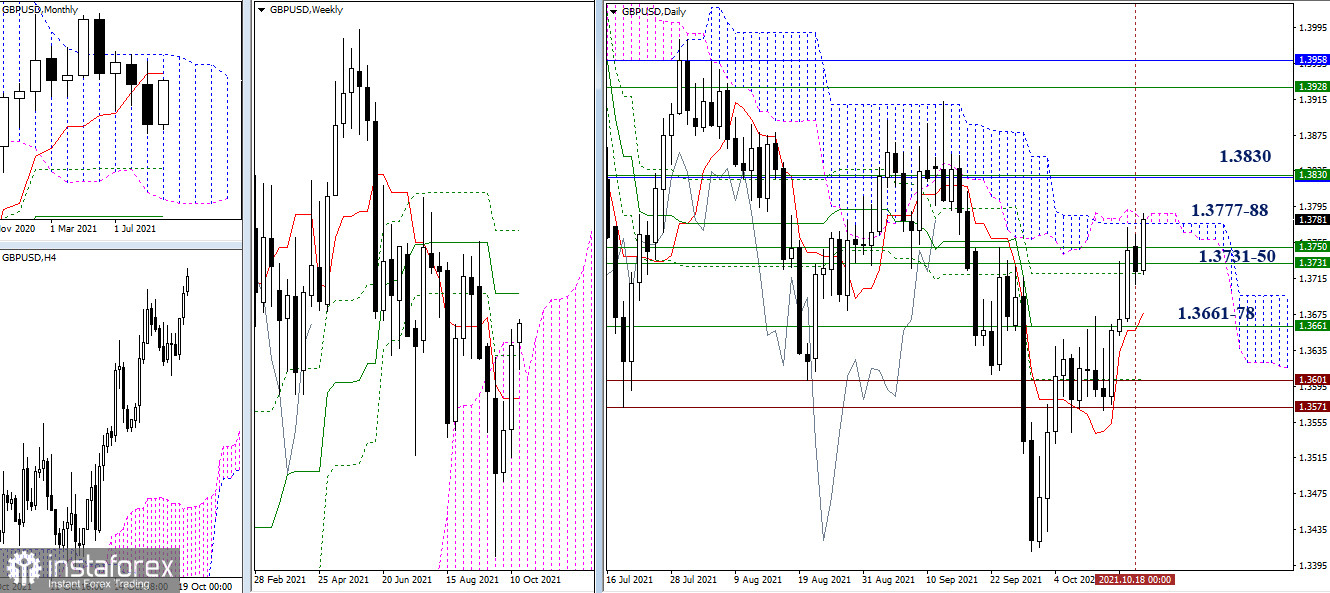
The pound indicated a slowdown during the previous day while meeting with the range of 1.3731-50 (the union of weekly levels). Today, it updated its high and reached the next resistance formed by the daily Ichimoku cloud (1.3777-88). Now, if the pound continues to rise, it will encounter the level of 1.3830 (weekly medium-term trend + monthly short-term trend). The nearest support levels in the higher timeframes are set at 1.3661-78 (weekly and daily Tenkan).
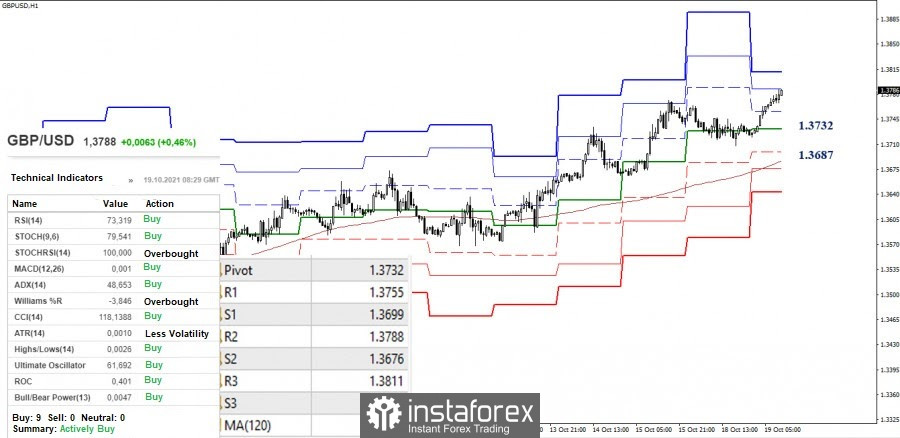
The advantage in the smaller timeframes remains on the side of the bulls. During the analysis, the second resistance of the classic pivot levels (1.3788) is tested. The next prospect will be an increase to the third resistance level of 1.3811 (R3). The key support in the same timeframe in case of a downward correction is waiting for the pair at the levels of 1.3732 (central pivot level) and 1.3687 (weekly long-term trend).
***
Ichimoku Kinko Hyo (9.26.52) and Kijun-sen levels in the higher time frames, as well as classic Pivot Points and Moving Average (120) on the H1 chart, are used in the technical analysis of the trading instruments.