 English
  Русский
 Bahasa Indonesia
 Bahasa Malay
 ไทย
ไทย Español
 Deutsch
 Български
 Français
 Tiếng Việt
 中文
中文 বাংলা
বাংলা हिन्दी
 Čeština
 Українська
 Română

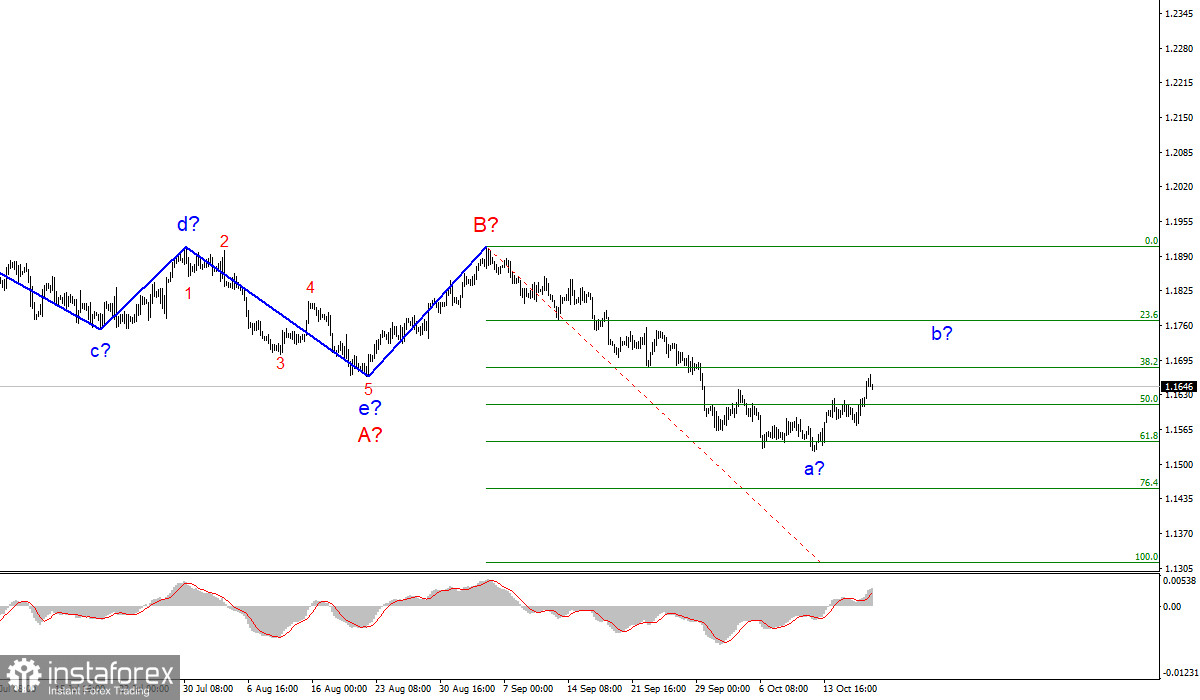
Wave pattern
On the 4-hour chart, the wave layout for the euro/dollar pair went through some changes after the quote had dropped below the low of the previous wave. So now, the a-b-c-d-e trend section, that was formed at the beginning of the year, can be referred to as A wave while the subsequent rise of the instrument will be interpreted as wave B. If this is true, then the assumed wave C is being formed now and it can take a very extended form. The internal wave a has completed its formation and turned out to be quite long. At the moment, the building of the corrective wave b has begun. As soon as its formation is finished, at least another descending wave should be formed. Therefore, the current wave layout does not indicate that the pair's downtrend is over. At the same time, the corrective structures look rather uncertain as they can become more complex at any moment or take a non-standard form. I would not recommend trading on the corrective b wave.
Uneventful Tuesday session
The news background was weak on Monday as there was only one report that could be of any interest to the markets. However, it caused no reaction at all. Industrial production in the US contracted instead of an expected rise. On Tuesday, the information background was even weaker as there were no significant reports or news. As it often happens, the movement in the market occurs when it is least expected. The chances for an active movement on Tuesday were very slim. Yet, the European currency found support and began to rise at midnight. The quotes started to retreat from the reached highs only in the afternoon. As I have already mentioned, there were no obvious reasons for the euro to rise. The pair passed 30 pips within the day. It does not necessarily mean that if there is no news, the instrument should stand still. So the pair proved this today. Despite the lack of any information background, the formation of the corrective b wave continued. Therefore, markets can count on the current wave layout. The question is whether the wave will take a more complex form. The corrective structures can be of any type. Even now, wave C can take a shorter form and can be completed soon. There is nothing we can do about this. We can only try to react to the changing wave structure as quickly as possible. I would like to remind you that a wave layout should be relevant rather than precise. Only then will it help you gain profit.
Conclusion
Based on the given analysis, I can conclude that the descending wave C will continue to form although a correction has started. I would advise you to wait for the wave to complete its formation and then sell the instrument following every sell signal of the MACD indicator. The targets are located at 1.1454 and 1.1314 which correspond with 76.4% and 100.0% Fibonacci.
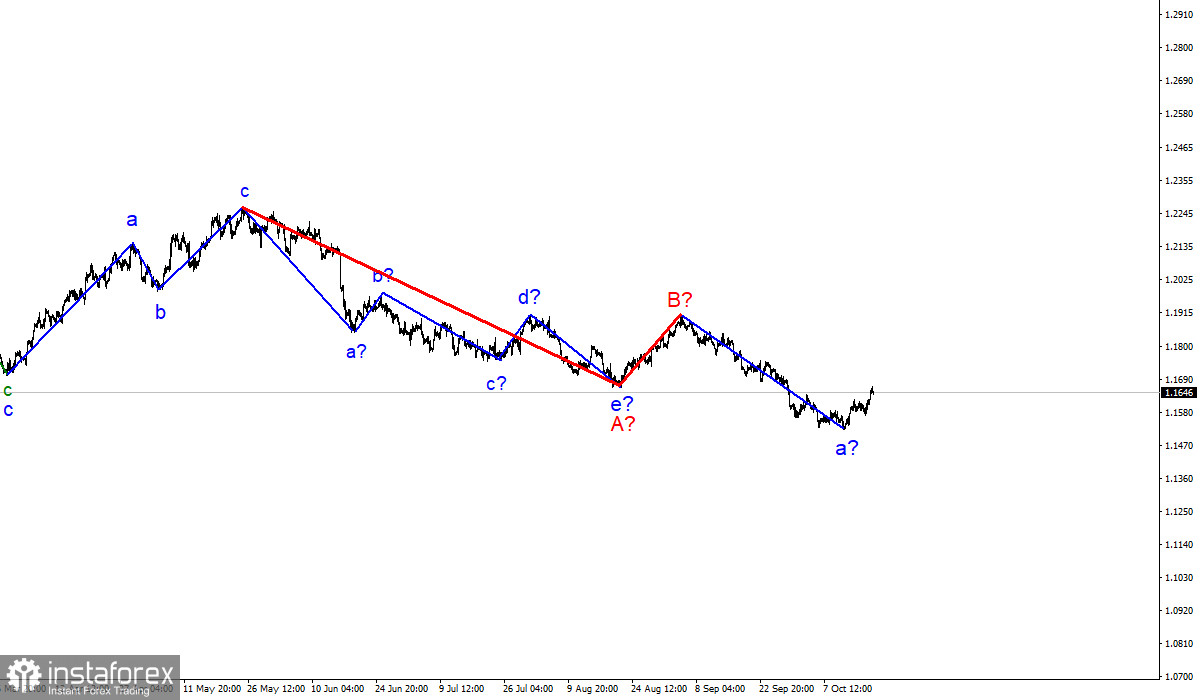
Larger time frame
The wave layout on a larger time frame looks quite convincing. The quotes keep moving lower. The descending section of the trend that was initiated on May 25 takes the form of a three-wave A-B-C corrective structure. Thus, the decline may continue for several more months until wave C is fully completed.