 English
  Русский
 Bahasa Indonesia
 Bahasa Malay
 ไทย
ไทย Español
 Deutsch
 Български
 Français
 Tiếng Việt
 中文
中文 বাংলা
বাংলা हिन्दी
 Čeština
 Українська
 Română

EUR/USD 5M
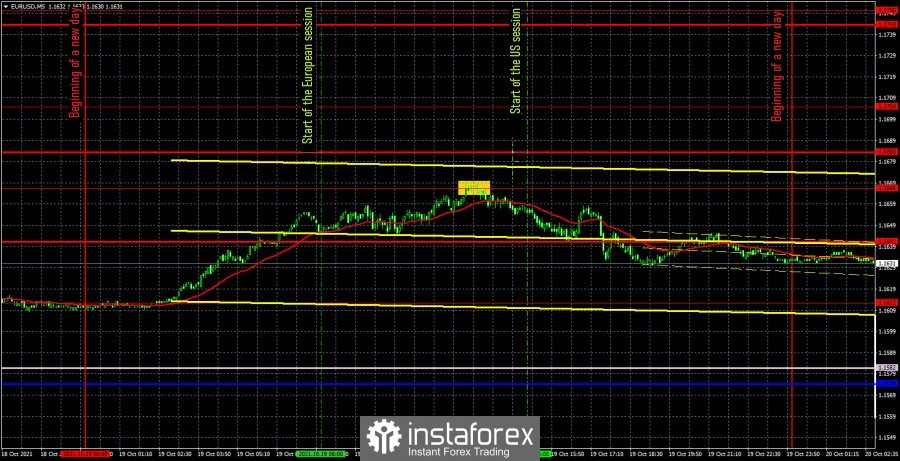
The EUR/USD pair moved better on Tuesday compared to Monday. No important macroeconomic or fundamental event in the United States or the European Union yesterday. Thus, traders had nothing to react to during the day. Nevertheless, the markets found reasons and reasons to increase their activity by one and a half times and bring the volatility indicator to 60 points, which is already quite good. It is a pity that we see such volatility once a week on average. It is also a pity that when such more or less strong movements begin, they occur at the most inconvenient time for traders. For example, yesterday's good trend movement started late at night and by the beginning of the European session, most of it was already behind. Nevertheless, one trading signal - to sell - was formed during the daytime. The price rose to the extremum level of 1.1666 and rebounded from it with almost perfect accuracy. Thus, traders should have taken short positions at this point. Subsequently, the euro/dollar pair dropped to the support level of 1.1641, which was previously a resistance, and bounced off it quite eloquently. Therefore, sell orders should have been closed at this time. And since signals are not formed near support and resistance levels, no more deals should have been opened during the day. The profit for one single trade was 13 points. Little, but better than nothing.
EUR/USD 1H
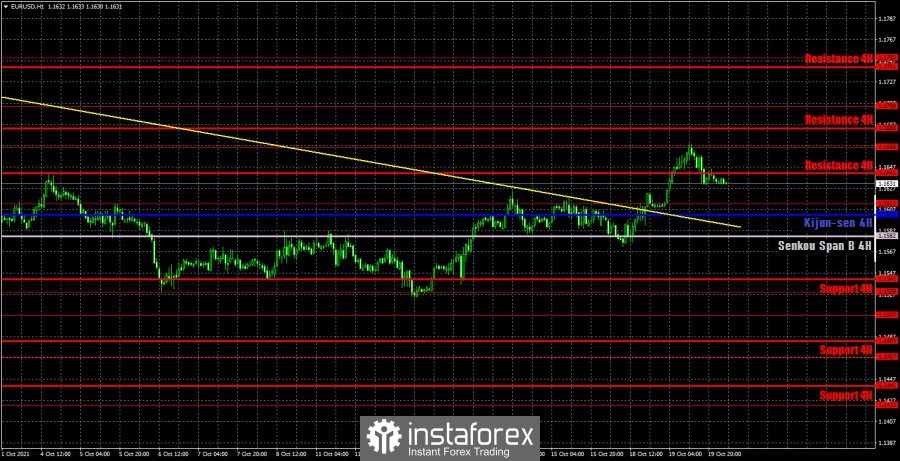
You can see that the euro/dollar pair has overcome the downward trend line on the hourly timeframe, so the trend has changed to an upward trend at this time and we can well count on further strengthening of the European currency. We have already said in articles on fundamental analysis that there were no compelling reasons for the dollar to rise in the last month and a half, so now there may be a backlash from the market, which will level its illogical behavior lately. Until the next Fed meeting, we believe that the dollar may continue to decline amid the weakening likelihood of curtailing the QE program due to weak macroeconomic statistics from overseas. On Wednesday, we highlight the following levels for trading - 1.1612, 1.1666 and 1.1704, as well as the Senkou Span B (1.1582) and Kijun-sen (1.1602) lines. The Ichimoku indicator lines can change their position during the day, which should be taken into account when looking for trading signals. Signals can be rebounds or breakthroughs of these levels and lines. Do not forget about placing a Stop Loss order at breakeven if the price moves 15 points in the right direction. This will protect you against possible losses if the signal turns out to be false. On October 20, the European Union will publish a relatively significant report on inflation for September, and the United States will publish the Fed's economic survey by regions, the "Beige Book". The latest review will be published late in the evening, so by then traders will have to leave the market anyway. But European inflation may have little impact on the movement of the pair.
We recommend you to familiarize yourself:
Overview of the EUR/USD pair. October 20. Janet Yellen: Our song is good, start over.
Overview of the GBP/USD pair. October 20. The US dollar is falling on all fronts. The UK is preparing to raise the key rate.
Forecast and trading signals for GBP/USD for October 20. Detailed analysis of the movement of the pair and trade deals.
Analysis of the COT report
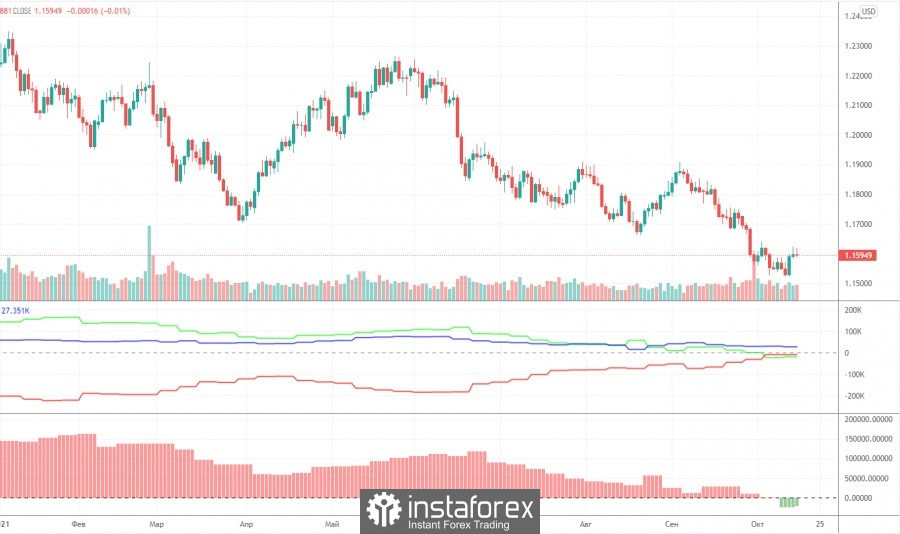
The mood of non-commercial traders practically did not change during the last reporting week (October 5-11). It even became a little less bearish. But all the same, it is already bearish, since for the first time in a long time the total number of open short positions for the "non-commercial" group exceeds the total number of open buy contracts (222,000 versus 203,000). During the reporting week, professional traders opened 5,700 buy contracts (longs) and 2,400 sell contracts (shorts). Thus, the net position increased by 3,300 contracts, but such a change is considered negligible for the general picture of things. We draw attention to another fact. At the beginning of this year, the net position of big players exceeded 150,000, and since then the European currency has fallen in price by only 6 cents, and the net position has lost about 170,000 contracts. We believe that the European currency has depreciated too weakly, given the changes in the data on contracts from professional players. We also draw attention to the fact that the euro is falling very weakly. As we have calculated more than once, by about 15 points a day. Every day, but the volatility still remains very weak. The weak volatility makes you doubt everything that is happening now with the pair. The US dollar still does not look like a currency that may show a strong trend in the near future. But, nevertheless, it continues to grow for more than a month. As a result, the Commitment of Traders (COT) reports now show a very likely continuation of the euro's decline. But we also recommend correlating these findings with the current technical picture.
Explanations for the chart:
Support and Resistance Levels are the levels that serve as targets when buying or selling the pair. You can place Take Profit near these levels.
Kijun-sen and Senkou Span B lines are lines of the Ichimoku indicator transferred to the hourly timeframe from the 4-hour one.
Support and resistance areas are areas from which the price has repeatedly rebounded off.
Yellow lines are trend lines, trend channels and any other technical patterns.
Indicator 1 on the COT charts is the size of the net position of each category of traders.
Indicator 2 on the COT charts is the size of the net position for the non-commercial group.