 English
  Русский
 Bahasa Indonesia
 Bahasa Malay
 ไทย
ไทย Español
 Deutsch
 Български
 Français
 Tiếng Việt
 中文
中文 বাংলা
বাংলা हिन्दी
 Čeština
 Українська
 Română

Wave pattern
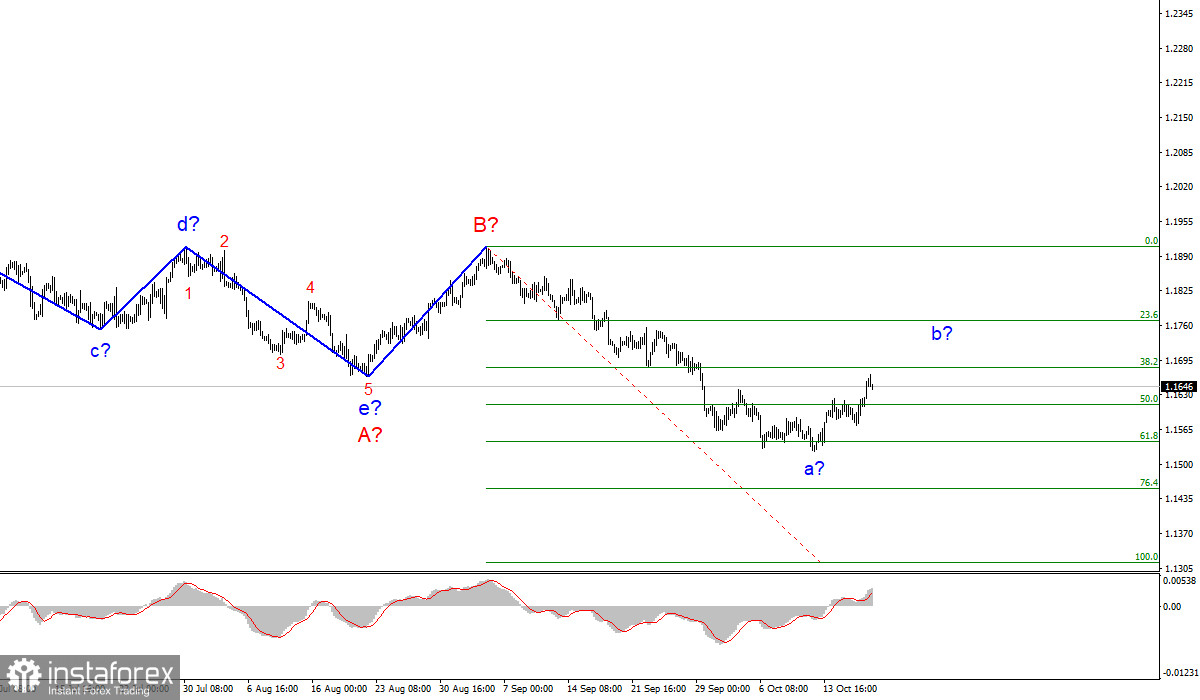
The wave counting of the 4-hour chart for the Euro/Dollar instrument suffered certain changes after the quotes fell below the low of the previous wave. Thus, now the a-b-c-d-e trend segment, which has been formed since the beginning of the year, is interpreted as wave A, and the subsequent increase in the instrument is interpreted as wave B. If this assumption is correct, then the construction of the proposed wave C has now begun and is continuing, which can take a very extended form. Its internal supposed wave a has completed its construction and has received a very extended form.
At this time, the construction of the corrective wave b has begun, after the completion of which at least one more downward wave should be built. Thus, the current wave counting does not indicate that the reduction of the instrument is completed. At the same time, corrective structures are very problematic, since at any moment they can become more complicated or take on an unusual appearance. I do not advise working out the corrective wave b. It is better to wait for its completion and work out wave C.
The amplitude of the Euro/Dollar pair was only recorded at 17 pips Wednesday, despite the strong news background. The UK inflation report was released, although it turned out to be as bland as possible. The value of inflation last month was 3.4% YoY, market expectations for September were 3.4% YoY, the real value was 3.4% YoY. Thus, the markets, maybe, would like to play on this report, but its value did not contribute to this. In the first half of the day, we saw a decrease in the quotes of the instrument, in the second – an increase, and all these movements were not caused by reports or other events in the United States or the European Union.
Thus, the usual market noise remains, which is part of wave b, which is corrective. This wave, if the current wave counting is correct, can continue for another 40-70 pips up. That is, an unsuccessful attempt to break through the 1.1683 mark, which corresponds to 38.2% Fibonacci, may lead to the completion of its construction.
However, I believe that the demand for the US currency may grow in the near future only if the market receives new evidence of the Fed's readiness to start tapering the QE program in November. On Tuesday, Fed board members Mary Daly and Michelle Bowman have already stated that they are ready to support QE tapering at the next meeting. Previously, this decision was supported by Rafael Bostic and James Bullard.
General conclusions
Based on the analysis, I conclude that the construction of the downward wave C will continue, but at this time an internal corrective wave is being built. Therefore, now I advise you to wait for the completion of this wave, and after that - to sell the instrument for each downward signal from the MACD, with targets located near the calculated marks of 1.1454 and 1.1314, which corresponds to 76.4% and 100.0% Fibonacci levels.
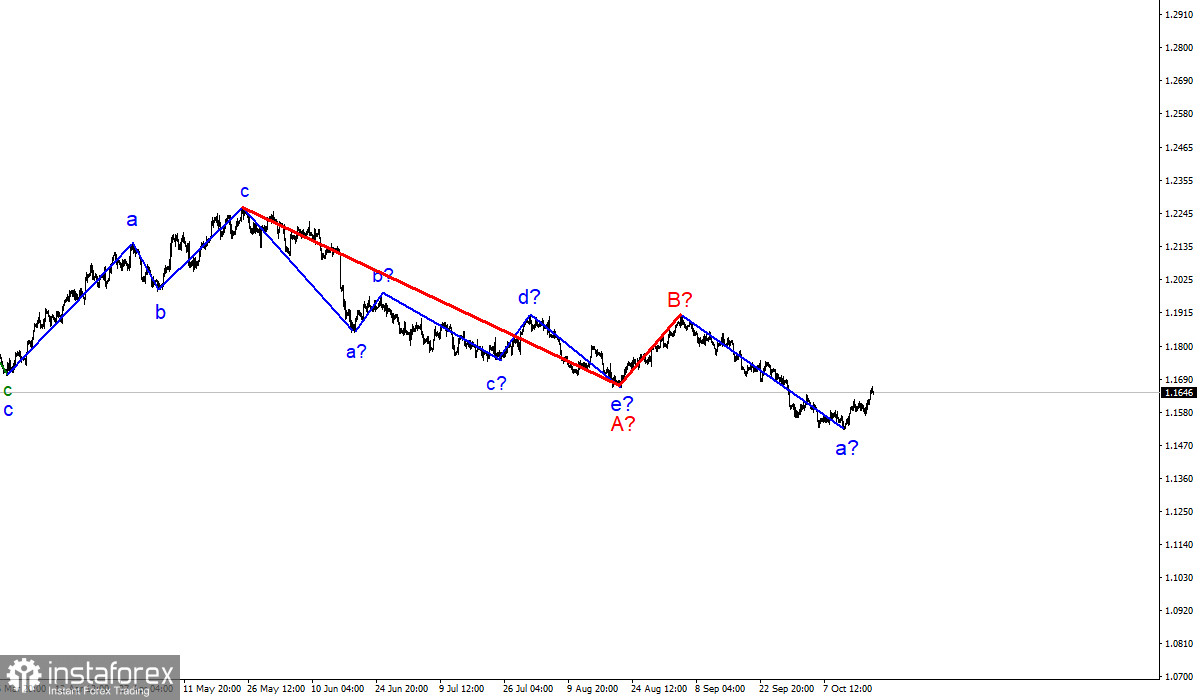
The wave counting of the higher scale looks quite convincing. The decline in quotes continues and now the downward section of the trend, which originates on May 25, takes the form of a three-wave corrective structure A-B-C. Thus, the decline may continue for several more months until wave C is fully completed.