 English
  Русский
 Bahasa Indonesia
 Bahasa Malay
 ไทย
ไทย Español
 Deutsch
 Български
 Français
 Tiếng Việt
 中文
中文 বাংলা
বাংলা हिन्दी
 Čeština
 Українська
 Română

GBP/USD 5M
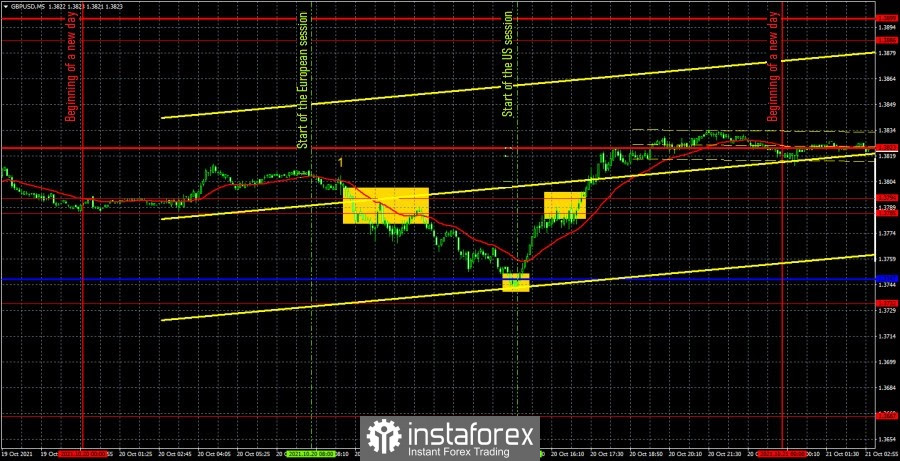
The GBP/USD pair was trading quite actively again on October 20, and the movements themselves were close to ideal. It should be noted right away that there was no single direction of movement during the day. The British currency fell in price during the European trading session, while it rose in price at the US one. Moreover, the upward reversal was sharp and occurred clearly at the opening of the US session, which is clearly seen in the chart. Considering that there were no important events and publications at this time, the reversal occurred solely due to the actions of US traders, possibly large players, who sharply turned the pair to the upside. The price did not have enough, literally 8 points, to reach the extremum level of 1.3732, but the critical Kijun-sen line lay at this point, which increased during the day, which made it possible to identify a buy signal here. Let's move on to examining the signals that have been generated. First, the price broke through the support area of 1.3785-1.3794. It did it with confidence, so traders could open short positions. In the next hour, the price returned two more times to the level of 1.3785, bounced off it twice, so at this time it was necessary to remain in open short positions. As a result, the price went down 35 points and reached the Kijun-sen line, from which it rebounded. It was necessary to close short positions here at a profit of 23 points and open long positions. The price almost without hindrance overcame the area of 1.3785-1.3794, so long positions should have been maintained here. The price also almost immediately reached the resistance level of 1.3823, from which it bounced initially. Therefore, at this moment, the long position should be closed. As a result, the profit amounted to 60 points. Signals are not formed near resistance levels, so more deals should not have been opened during the day.
GBP/USD 1H
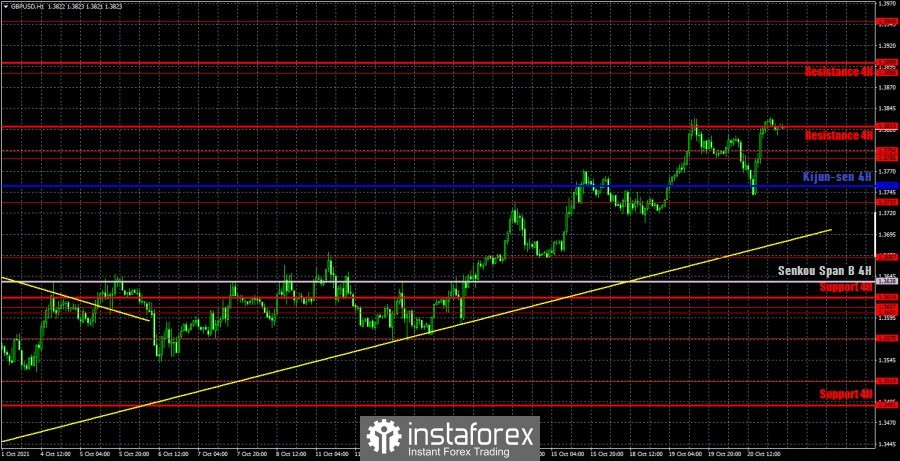
The pound/dollar pair maintains an upward trend on the hourly timeframe and continues its upward movement. The hourly TF shows even better how the price reversed sharply today in the middle of the day. It was impossible to predict such a turn. Nevertheless, the price still bounced off the critical line, which was a signal that the upward trend, which has been going on for several weeks, continues. At the same time, we once again draw attention to the fact that there are no fundamental reasons for the pound to rise in price now. Most likely, the markets are selling the dollar, as they are tired of waiting for a clear announcement from the Federal Reserve about the curtailment of the QE program. We also pay attention to the fact that the euro/dollar and pound/dollar pairs are moving completely differently now. We distinguish the following important levels on October 21: 1.3667, 1.3732, 1.3785 - 1.3794, 1.3886. Senkou Span B (1.3638) and Kijun-sen (1.3752) lines can also be signal sources. It is recommended to set the Stop Loss level at breakeven when the price passes in the right direction by 20 points. The Ichimoku indicator lines can move during the day, which should be taken into account when looking for trading signals. There will be no major publications or any other fundamental events on Thursday in the UK and the United States. A couple of minor reports are all that traders will have at their disposal. Thus, today we will have to trade again using pure technique.
We recommend you to familiarize yourself:
Forecast and trading signals for EUR/USD for October 21. Detailed analysis of the movement of the pair and trade deals.
COT report
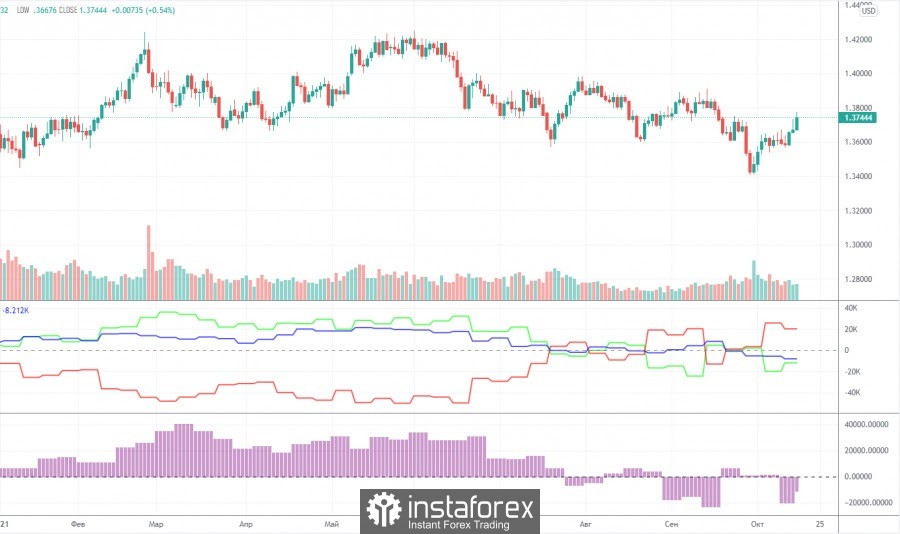
The mood of professional traders became less bearish again during the last reporting week (October 5-11). Major players closed 1,700 buy contracts (longs) and 10,600 sell contracts (shorts) during the week. Thus, the net position of professional traders has grown by almost 9,000, which is quite a lot for the pound. In principle, such a change in the mood of major players correlates well with how the pair moved during the same time period. The pound was growing, so it's reasonable to assume that the big players were buying it, not selling it. However, we are most interested in the general trend in COT reports. That is, how non-commercial traders behave over a long distance. And now let's look at the first indicator, especially at its movements over the past three months. The green and red lines (net positions of non-commercial and commercial traders) constantly change the direction of movement, cross each other, cross the zero mark. This suggests that there is no clear mood among the major players right now. It is constantly changing, which means there is no trend now. Moreover, if you look at the movements of the pair itself over the past 6-7 months, it is also clearly visible that the minimum downward trend is, of course, present, but still the quotes spent most of the time between the 36th level and the 42nd. That is, inside the horizontal channel. Thus, from our point of view, the Commitment of Traders (COT) reports now do not provide an opportunity to predict the pair's succeeding movement.
Explanations for the chart:
Support and Resistance Levels are the levels that serve as targets when buying or selling the pair. You can place Take Profit near these levels.
Kijun-sen and Senkou Span B lines are lines of the Ichimoku indicator transferred to the hourly timeframe from the 4-hour one.
Support and resistance areas are areas from which the price has repeatedly rebounded off.
Yellow lines are trend lines, trend channels and any other technical patterns.
Indicator 1 on the COT charts is the size of the net position of each category of traders.
Indicator 2 on the COT charts is the size of the net position for the non-commercial group.