 English
  Русский
 Bahasa Indonesia
 Bahasa Malay
 ไทย
ไทย Español
 Deutsch
 Български
 Français
 Tiếng Việt
 中文
中文 বাংলা
বাংলা हिन्दी
 Čeština
 Українська
 Română

Trend analysis (Fig. 1)
The price from the level of 1.3750 (closing of Friday's daily candlestick) is likely to rise today to the target of 1.3792 – the pullback level of 76.4% (yellow dotted line). After this level is reached, its growth may resume to the target of 1.3837 – the pullback level of 85.4% (yellow dotted line).
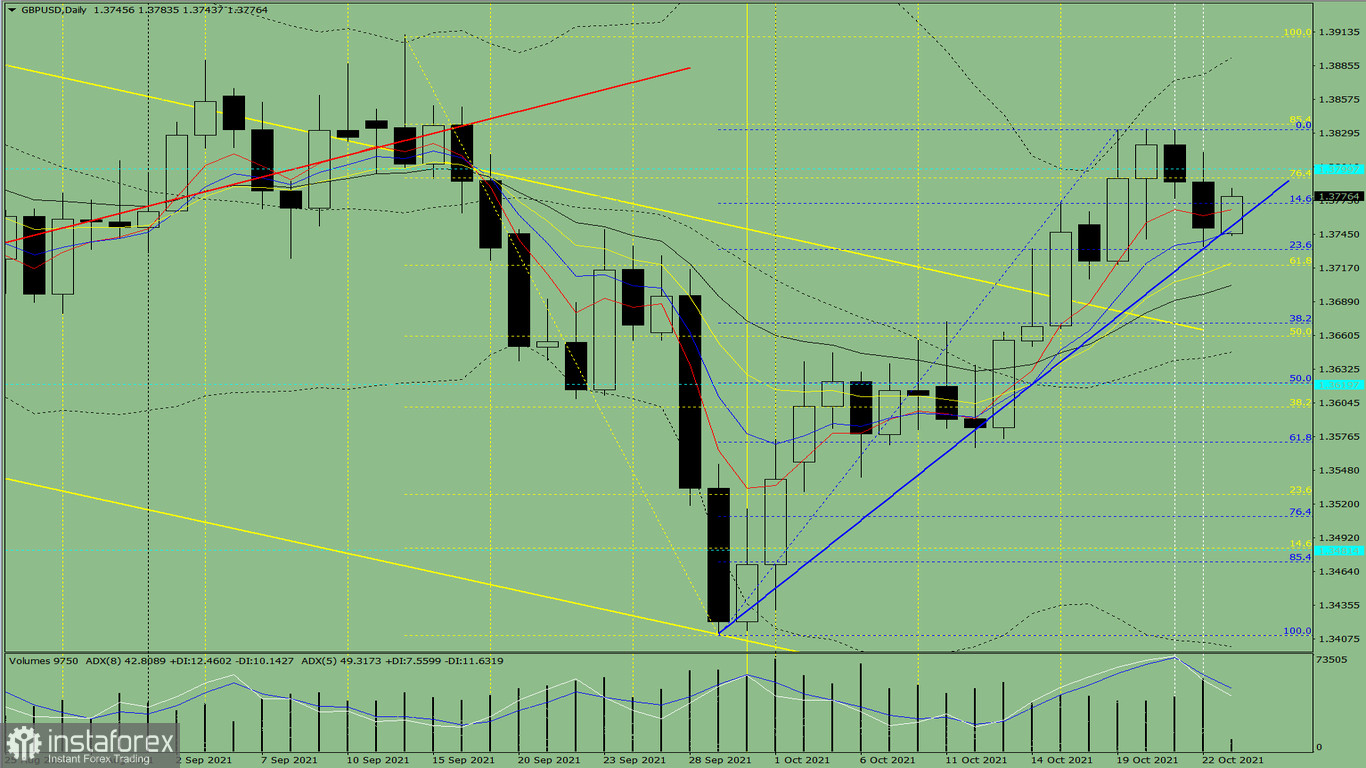
Figure 1 (daily chart)
Comprehensive analysis:
- Indicator analysis - up
- Fibonacci levels - up
- Volumes - up
- Candlestick analysis - up
- Trend analysis - up
- Bollinger lines - up
- Weekly chart - up
General conclusion:
Today, the price from the level of 1.3750 (closing of Friday's daily candlestick) may increase to the target of 1.3792 – the pullback level of 76.4% (yellow dotted line). After reaching it, it may further rise to the target of 1.3837 – the pullback level of 85.4% (yellow dotted line).
Alternatively, it is also possible for the price from the level of 1.3750 (closing of Friday's daily candlestick) to start surging to the target of 1.3792 – the pullback level of 76.4% (yellow dotted line) and then decline to the target of 1.3732 – the pullback level of 23.6% (blue dotted line). After reaching this level, the upward movement may resume.