 English
  Русский
 Bahasa Indonesia
 Bahasa Malay
 ไทย
ไทย Español
 Deutsch
 Български
 Français
 Tiếng Việt
 中文
中文 বাংলা
বাংলা हिन्दी
 Čeština
 Українська
 Română

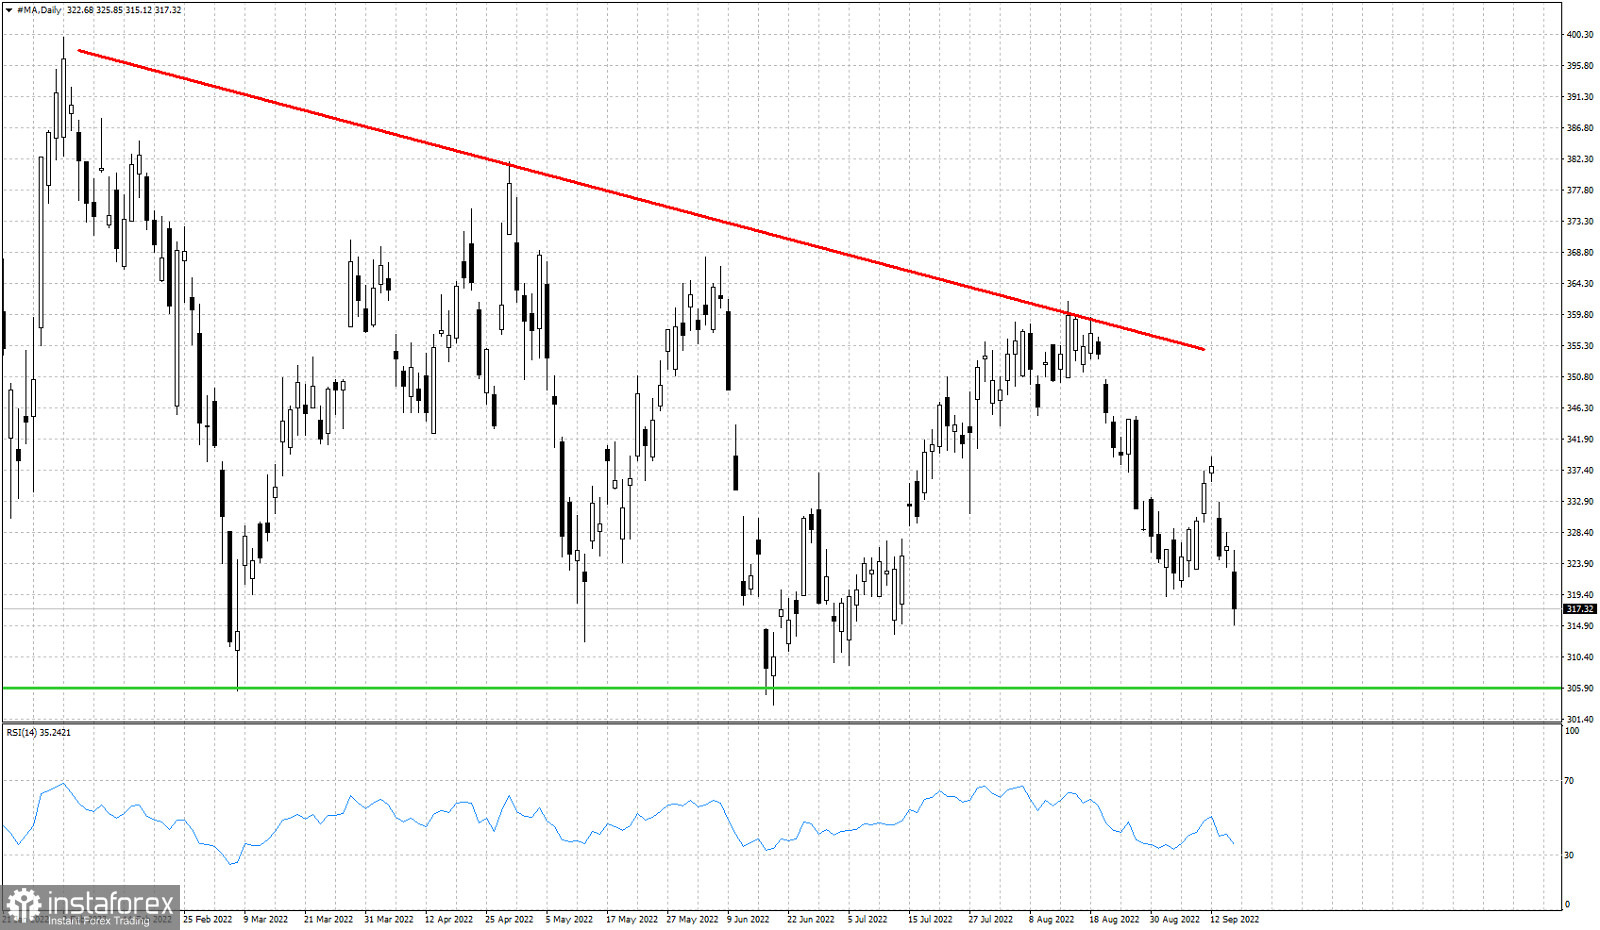
Red line- resistance
Green line- support
Over the past few weeks we mentioned the descending triangle pattern formed in the MA stock chart. Our most recent analysis warned traders that a rejection around $360 would be a bearish sign and would increase chances of another pull back towards the horizontal support of $300. Today price made a new lower low after a lower high confirming that bears remain in control of the short-term trend. Price closed just below $317 approaching our target of $300-$306. This formation has even more bearish implications specially if price does not respect the horizontal support around $300. A break below this level would be a major bearish signal.