 English
  Русский
 Bahasa Indonesia
 Bahasa Malay
 ไทย
ไทย Español
 Deutsch
 Български
 Français
 Tiếng Việt
 中文
中文 বাংলা
বাংলা हिन्दी
 Čeština
 Українська
 Română

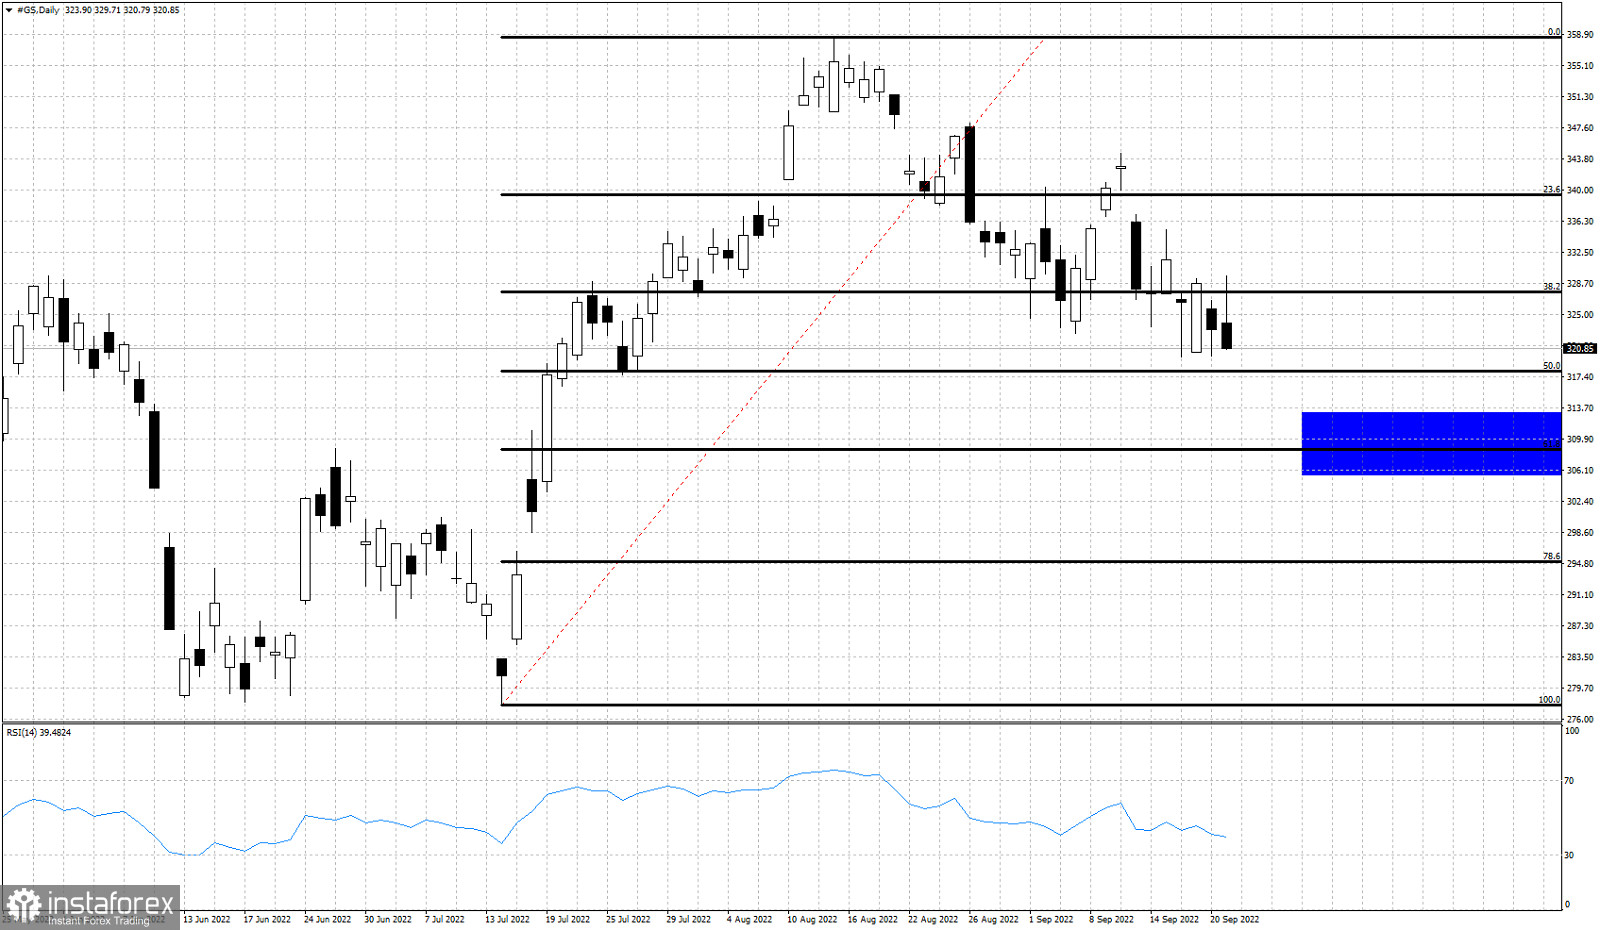
Black lines- Fibonacci retracement levels
Blue rectangle- short-term target area
Around September 14th we posted an analysis on GS stock. At that point GS stock was trading around $327 and we noted that the decline is most probably not over and that price could be heading towards $310. Price has broken below the $322 low and is moving to new short-term lower lows. At $317-18 we find the next Fibonacci retracement support, but we believe the most probable target area is shown in the Daily chart above with a blue rectangle. The 61.8% Fibonacci retracement level is our most probable target.