 English
  Русский
 Bahasa Indonesia
 Bahasa Malay
 ไทย
ไทย Español
 Deutsch
 Български
 Français
 Tiếng Việt
 中文
中文 বাংলা
বাংলা हिन्दी
 Čeština
 Українська
 Română

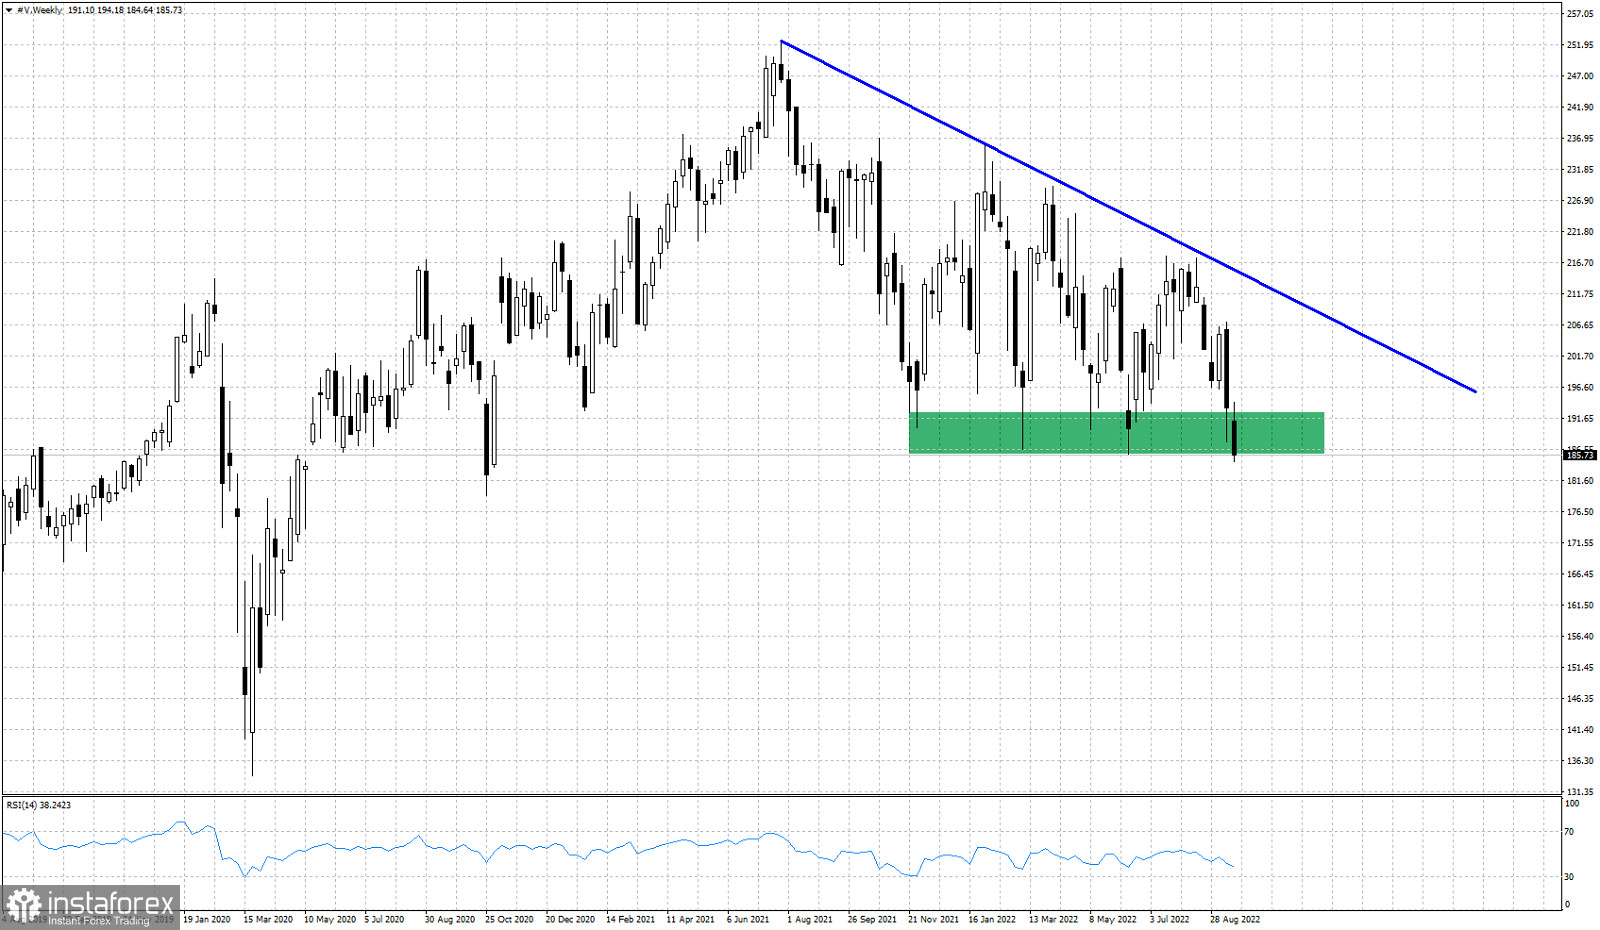
Blue line- resistance
Green rectangle- support
Another stock price that had recently formed a descending triangle pattern is showing signs of further weakness by breaking below the horizontal support that was held since November of 2021 and was tested four times and did not break. The fifth time was the one that support failed to hold. The lower highs of the triangle pattern were the first sign of weakness. As long as price is below the blue downward sloping trend line we remain pessimistic. Bulls will need to recapture $192 fast if they want to have hope for a reversal. The RSI is far from oversold levels in the weekly chart. We believe V stock price is vulnerable to a move towards $161.