 English
  Русский
 Bahasa Indonesia
 Bahasa Malay
 ไทย
ไทย Español
 Deutsch
 Български
 Français
 Tiếng Việt
 中文
中文 বাংলা
বাংলা हिन्दी
 Čeština
 Українська
 Română

Technical outlook:
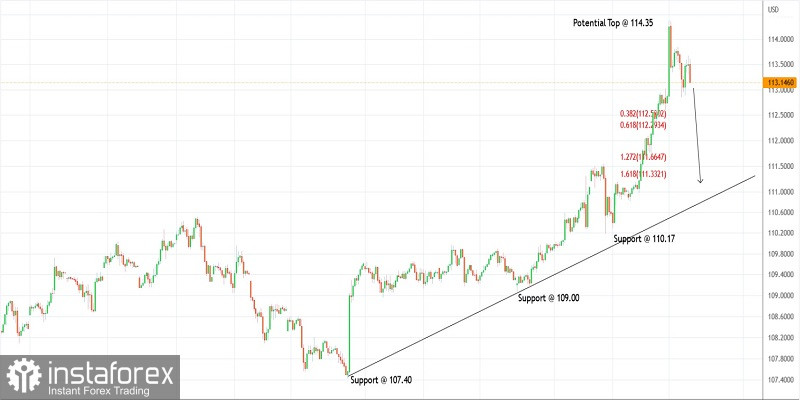
The US dollar index rose to fresh highs at about 114.35 during the early trading hours on Monday before finding resistance and reversing sharply lower. The index is seen to be trading close to 113.00 at this point in writing. It is expected to continue drifting lower towards 110.17 going forward. The bulls might have carved a potential top around 114.36 as the bears are getting ready to break below 112.85 now.
The 1-hour chart presented here is indicating initial support at 110.17, followed by 109.00 and 107.40 levels. Potential resistance stays at 114.35 respectively. A break below 110.17 will confirm with respect to the price action that a top is in place and the bears are back in control. It is not shown here but a Doji/Pinbar candlestick pattern is being carved on the daily chart.
The US dollar index might be setting up for a larger-degree corrective drop towards 107.40 and further in the coming weeks. We need to see a bearish candle formation on the daily chart to confirm the same. While it is early to confirm a bearish resumption, a high probability remains for a meaningful top to be in place at 114.35 so that the bears are back in control soon.
Trading idea:
Preparing for a potential drop against 114.35 soon.
Good luck!