 English
  Русский
 Bahasa Indonesia
 Bahasa Malay
 ไทย
ไทย Español
 Deutsch
 Български
 Français
 Tiếng Việt
 中文
中文 বাংলা
বাংলা हिन्दी
 Čeština
 Українська
 Română

Technical outlook:
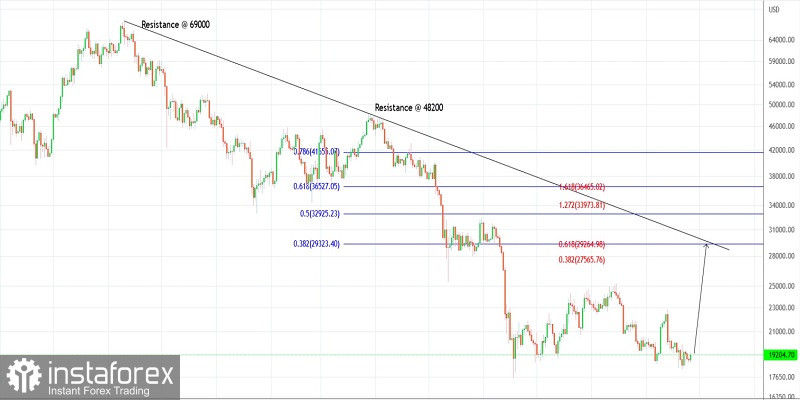
Bitcoin dropped below $18,200 over the last week before finding support and bouncing back to $19,500, producing a bullish candlestick pattern on the daily chart. The crypto seems to have carved a higher low around the $18,600 level and is now preparing to push higher towards at least $22,900. Bulls are looking to be back in control by holding above the $18,200 mark.
Bitcoin has carved a larger degree bearish boundary between $69,000 and $17,500 as can be seen on the daily chart presented here. The recent downswing being worked upon is between $48,200 and $17,500. A potential target is seen towards the $29,500 level, which is also the 0.382 Fibonacci retracement of the above downswing. Strong resistance is expected to be seen there.
There is also the Fibonacci convergence seen around $29,500 which increases the probability of a strong bearish reversal. Alternatively, if the price continues to slide from there, it could break below $17,500 and slide further towards at least $15,000. As long as the $17,500 support stays intact, prices are likely to move higher.
Trading plan:
Potential rally towards $29,500 against $17,500
Good luck!