 English
  Русский
 Bahasa Indonesia
 Bahasa Malay
 ไทย
ไทย Español
 Deutsch
 Български
 Français
 Tiếng Việt
 中文
中文 বাংলা
বাংলা हिन्दी
 Čeština
 Українська
 Română

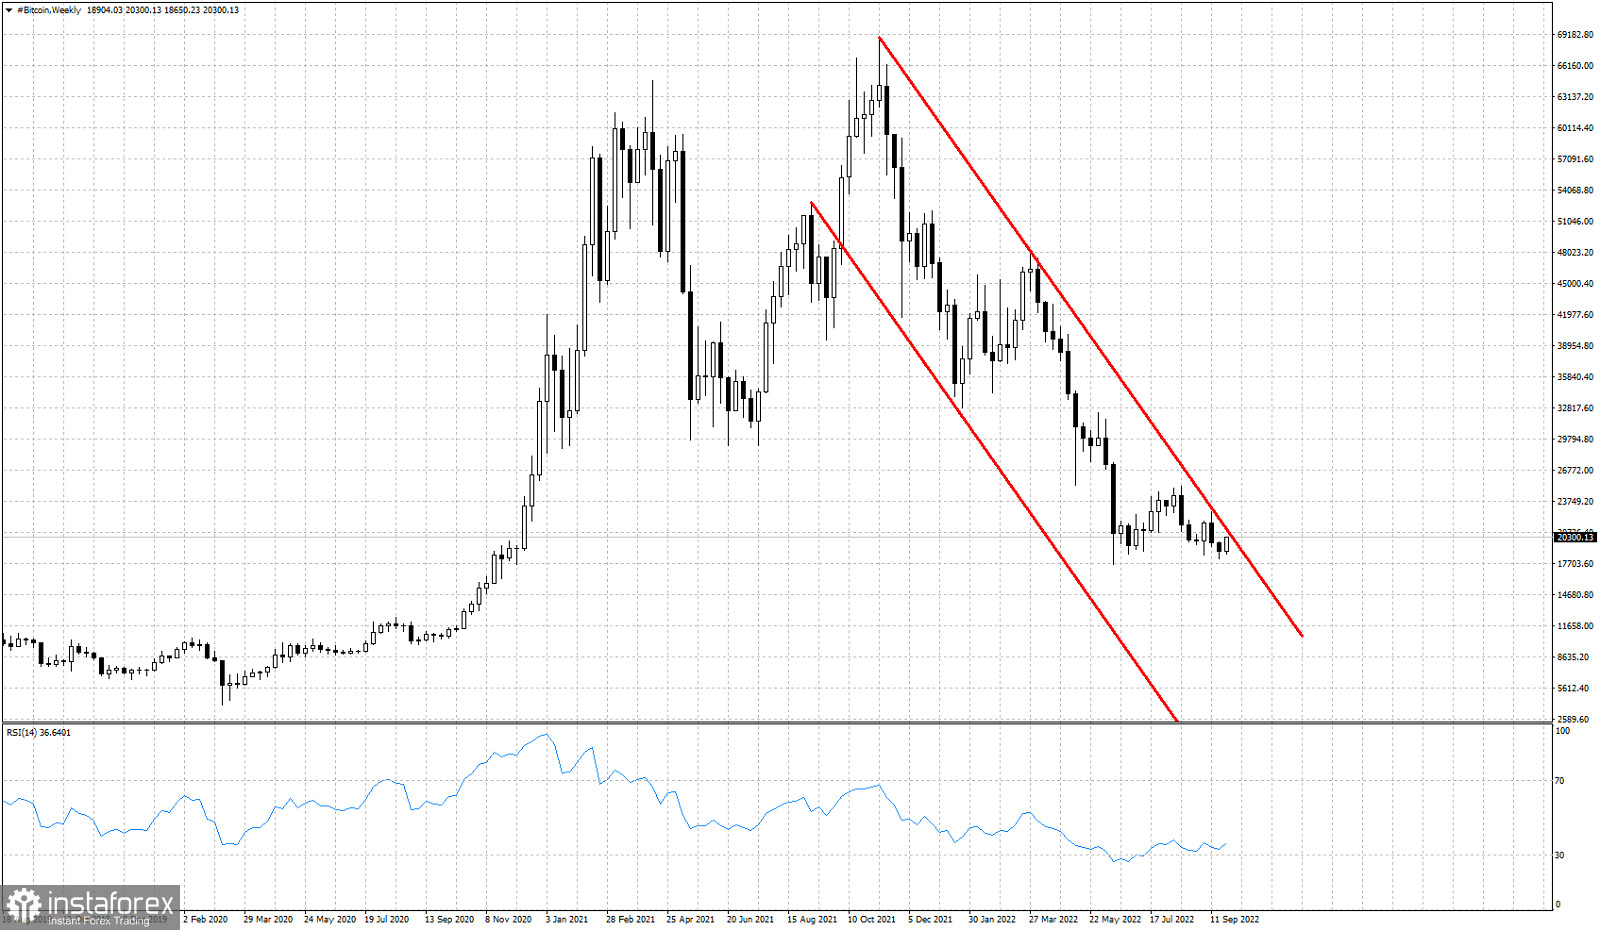
Red lines- bearish channel
Bitcoin has broken above it's short-term resistance of $19,500 and is trading again above the $20,000 price level. This short-term push higher by its own is nothing important. Looking at the weekly chart price remains inside the weekly downward sloping channel and below its upper boundary. In order for Bitcoin bulls to have hopes for a bigger move higher towards $30,000, we need to see price break above the resistance of $22,800 and start making higher highs and higher lows. The $22,800-$23,500 zone is important resistance that bulls need to break in order to change short-term trend. Until then price will remain vulnerable to more downside.