 English
  Русский
 Bahasa Indonesia
 Bahasa Malay
 ไทย
ไทย Español
 Deutsch
 Български
 Français
 Tiếng Việt
 中文
中文 বাংলা
বাংলা हिन्दी
 Čeština
 Українська
 Română

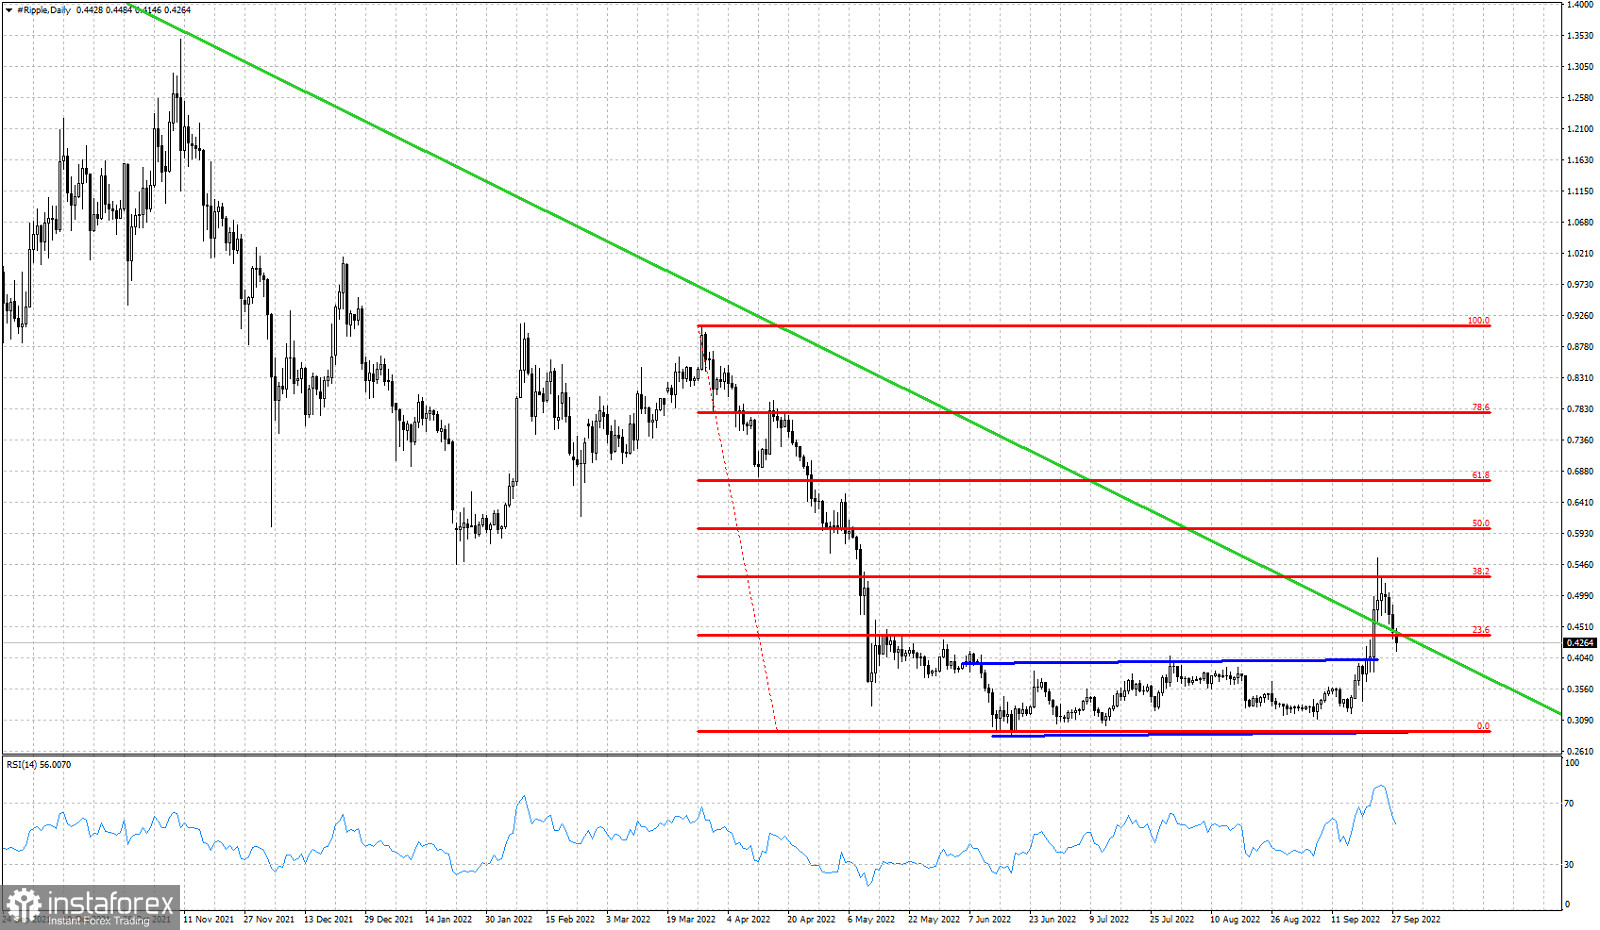
Red lines- Fibonacci retracements
Green line -resistance trend line
Blue lines- trading range
XRPUSD is trading around $0.42. Price managed to push as high as $0.5563 but bulls can not defend and stay above the downward sloping resistance trend line. Pushing below the resistance trend line after a break out is bearish. It is a sign of weakness. Price is again under pressure. Bulls need to defend recent lows at $0.3975 where we find the upper boundary of the trading range it was in. Bulls need to form a higher low and then attempt an attack against the recent highs of $0.5563. The rejection at the 38% Fibonacci retracement is something normal. This pull back could prove to be an important buying opportunity if bulls manage to built a higher low.