 English
  Русский
 Bahasa Indonesia
 Bahasa Malay
 ไทย
ไทย Español
 Deutsch
 Български
 Français
 Tiếng Việt
 中文
中文 বাংলা
বাংলা हिन्दी
 Čeština
 Українська
 Română

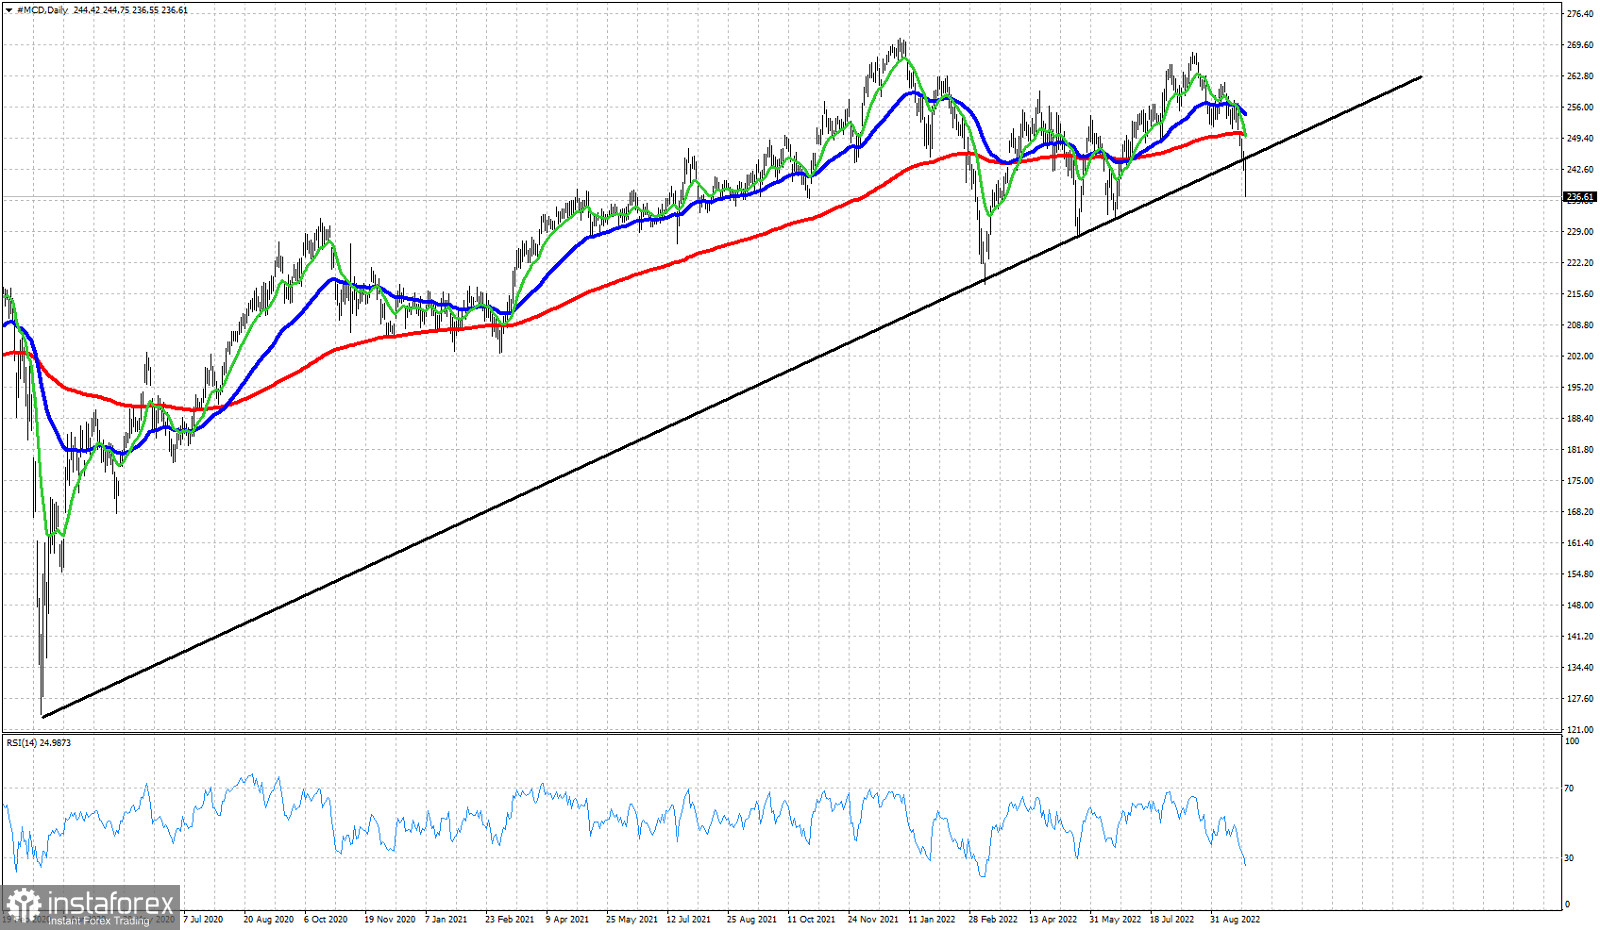
Black line- support trend line
Red line- 200 Exponential MA
Blue line- 50 Exponential MA
Green line - 13 Exponential MA
Recent price action in MCD has been extremely bearish. There are increased chances that the upward move from 2020 lows is complete and we should at least see a corrective pull back. Price has broken below the key upward sloping resistance trend line after being tested twice. The importance of the trend line was confirmed by previous price action. Price not only has broken below the trend line support, in the Daily chart we also see price below all three MA indicators. Apart from the 200 DMA, the other DMA are negatively sloped and the 13 DMA has crossed below the 5DMA. The Daily RSI has just reached oversold conditions. Current chart, points to more downside implying that MCD should head towards $200 or lower.