 English
  Русский
 Bahasa Indonesia
 Bahasa Malay
 ไทย
ไทย Español
 Deutsch
 Български
 Français
 Tiếng Việt
 中文
中文 বাংলা
বাংলা हिन्दी
 Čeština
 Українська
 Română

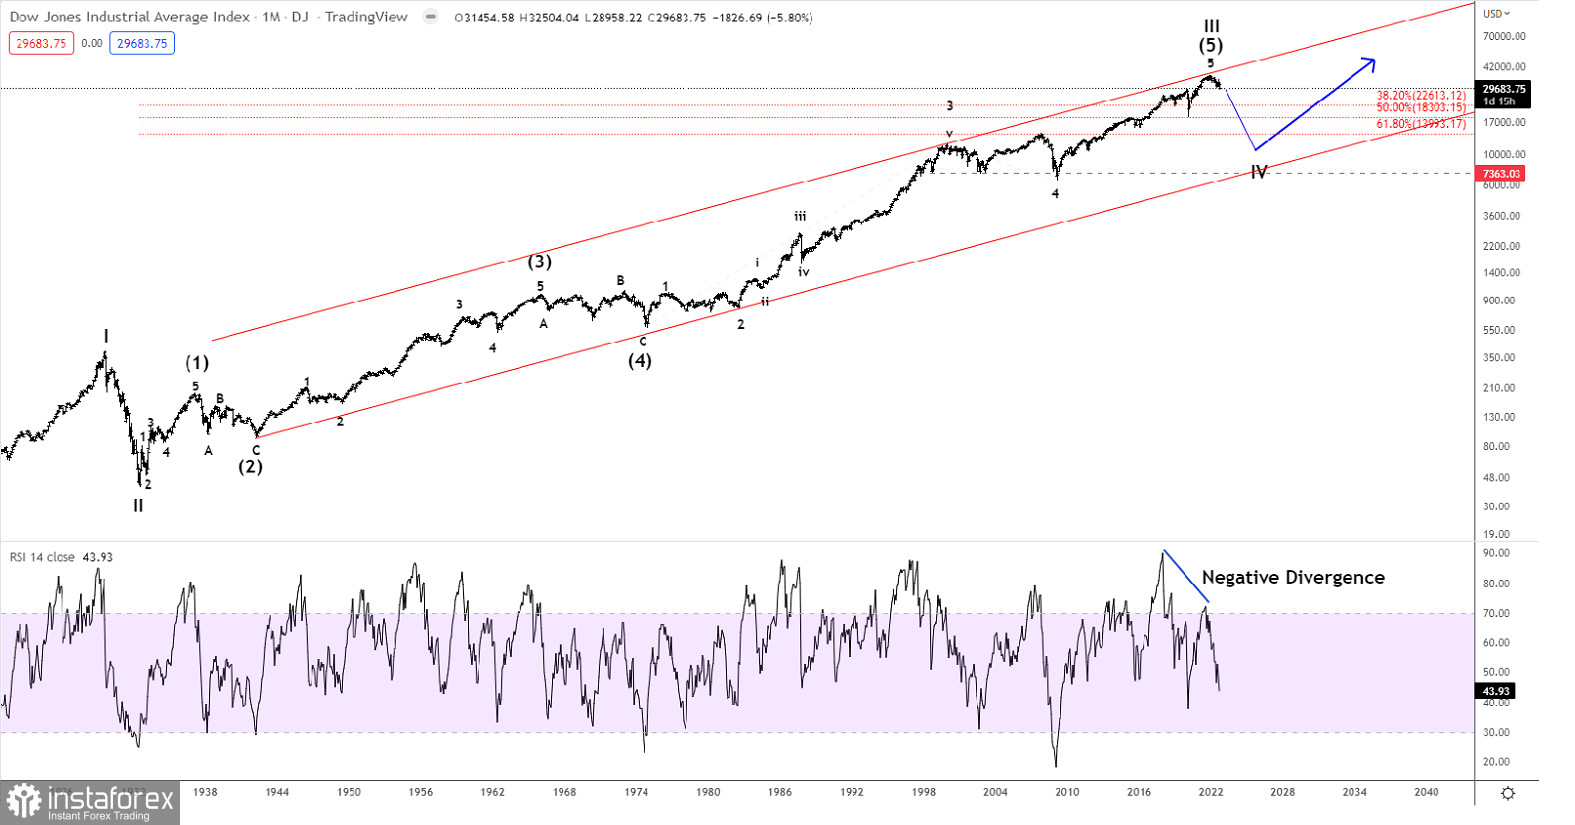
Today we will look at the long-term chart of the Dow Jones Index dating back to 1921, but the period we would like to focus on is from the 1932 low at 40.56 to the peak on January 2022 at 36,952. If our long-term count is correct, then we have a complete five-wave rally. A corrective decline that will take years has begun. Looking at the major corrections of 1932 - 2022 (90 years), we see the first correction from 1937 - 1942 (5 years). The next major correction stretched from 1966 to 1974 (8 years). Then, we had the 2000 to 2009 correction (8-9 years). Now the index is going through a correction as well. This correction is of a larger degree and therefore is likely to take at least 8 years and possibly even longer. The expected correction doesn't have to be very deep, but the rally from 40.56 to 36,952 does open up for a decline to near the bottom of wave 4 which was the 2009 low. If that is seen, then it is likely to terminate near 7,363, but a decline closer to the 50 to 61.8% corrective targets at 18,303 or maybe even closer to 13,993 is the most likely scenario, though that's also quite a distance to cover from the present 29,684 level.
We are braced for hard times in the years ahead with some major changes to the society as we know it today.