 English
  Русский
 Bahasa Indonesia
 Bahasa Malay
 ไทย
ไทย Español
 Deutsch
 Български
 Français
 Tiếng Việt
 中文
中文 বাংলা
বাংলা हिन्दी
 Čeština
 Українська
 Română

Weekly Review:
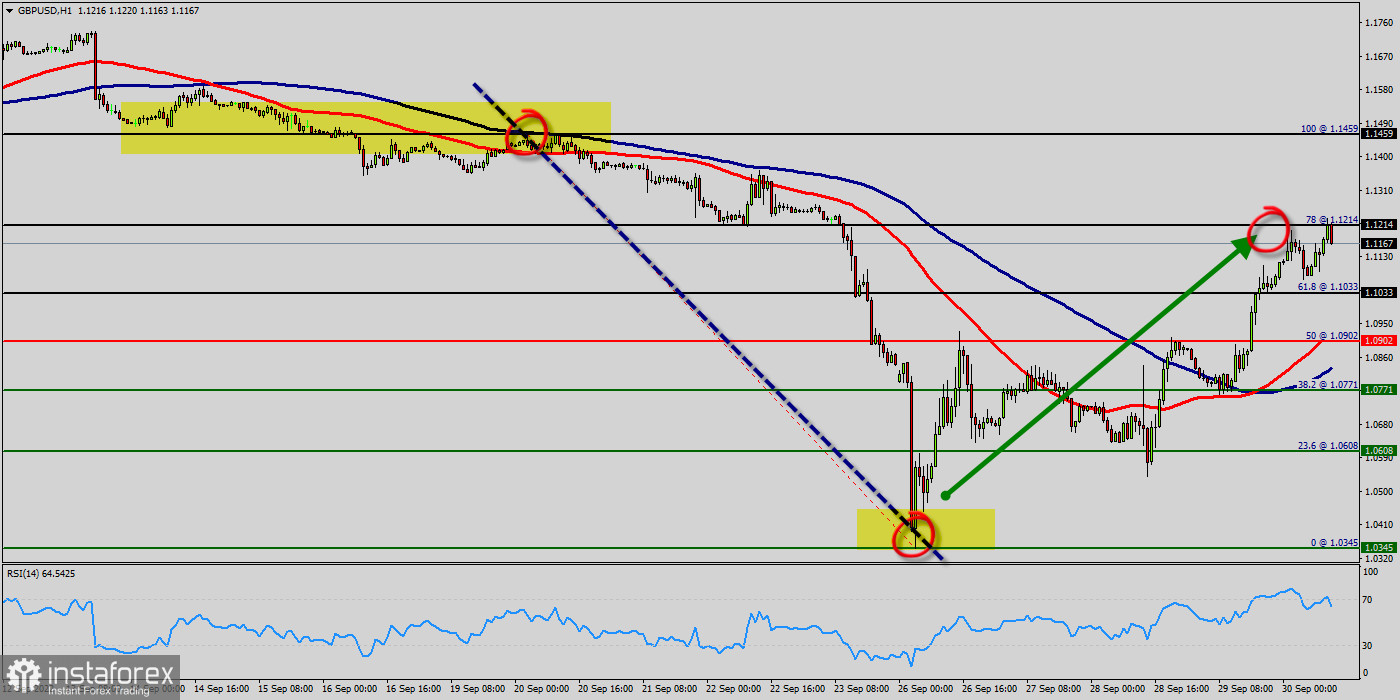
First two days of the week between 26th and 28th of Sept. 20022. The bullish trend is currently very strong on the GBP/USD pair. As long as the price remains above the support levels of 1.0071, you could try to benefit from the growth. The first bullish objective is located at the price of 1.0902. The bullish momentum would be boosted by a break in this resistance (1.0902). The hourly chart is currently still bullish. At the same time, some stabilization tendencies are visible between 1.0071 and 1.1033. Together with the relatively large distance to the fast-rising 100-day moving average (1.0902), there are some arguments for a relief rally in coming months on the table. The GBP/USD pair is at highest against the dollar around the spot of 1.0902 since last week. The GBP/USD pair is inside in upward channel. For three weeks the GBP/USD pair decreased within an up channel, for that the GBP/USD pair its new highest 1.1033. Consequently, the first support is set at the level of 1.0771. Hence, the market is likely to show signs of a bullish trend around the area of 1.0902 - 1 USD. RSI is seeing major support above 70% and a bullish divergence vs price also signals that a reversal is impending. According to the previous events the price is expected to remain between 1.0902 and 1.1214 levels. Buyers would then use the next resistance located at 1.1214 as an objective. Crossing it would then enable buyers to target 1.1214 (the double top - last bullish week). Be careful, given the powerful bullish rally underway, excesses could lead to a possible correction in the short term. If this is the case, remember that trading against the trend may be riskier. It would seem more appropriate to wait for a signal indicating reversal of the trend. The GBP/USD pair has plunged up for a fresh two weeks high. Prices pushed above a key retracement from a Fibonacci setup that spans from the lowest price of 1.0902 (50% of Fibonacci on the hourly chart), for that buyer pulled the bid back-above that level by the end of the week. Last week, the GBP/USD pair traded up and closed the day in the red area near the price of 1.0902. Today it rose a little, rising above 1.0608. If the pair succeeds in passing through the level of 1.0902, the market will indicate the bullish opportunity above the level of 1.0902 in order to reach the second target at 1.1033. In the very short term, the general bullish sentiment is confirmed by technical indicators. Therefore, a small upwards rebound in the very short term could occur in case of excessive bearish movements. The trend is still bullish as long as the price of 1.1033is not broken. Thereupon, it would be wise to re-buy above the price of at 1.1033 with the objective of 1.1214. We should see the pair climbing towards the next target of 1.1214. The pair will move upwards continuing the development of the bullish trend to the level 1.1303 in coming days.
The last two days of the week between 28th and 30th of Sept. 2022. The GBP/USD pair will continue rising from the level of 1.0608 in the long term. It should be noted that the support is established at the level of 1.0608 which represents the last bearish wave. The price is likely to form a double bottom in the same time frame. Accordingly, the GBP/USD pair is showing signs of strength following a breakout of the highest level of 1.0771. So, buy above the level of 1.0771 with the first target at 1.0902 in order to test the daily resistance 2. The buyers' bullish objective is set at the level of 1.0902. A bullish break in this resistance would boost the bullish momentum. The buyers could then target the resistance located at 1.0902. This suggests that the pair will probably go up in coming hours. If the trend is able to break the level of 1.0771, then the market will call for a strong bullish market towards the objective of 1.1003 this week. If there is any crossing, the next objective would be the resistance located at 1.1003. The level of 1.1003 is a good place to take profits. Moreover, the RSI is still signaling that the trend is upward as it remains strong above the moving average (100). Since the trend is above the 38.2% Fibonacci level, it means the market is still in a uptrend. From this point, the GBP/USD pair is continuing in a bullish trend from the new support of 1.0771. This is shown to us as the current price is in a bullish channel. According to the previous events, we expect that the GBP/USD pair will move between 1.0771 and 1.1003. However, beware of bullish excesses that could lead to a possible short-term correction; but this possible correction would not be tradeable. On the other hand, in case a reversal takes place and the GBP/USD pair breaks through the support level of 1.0608, a further decline to 1.05010 can occur. It would indicate a bearish market.