 English
  Русский
 Bahasa Indonesia
 Bahasa Malay
 ไทย
ไทย Español
 Deutsch
 Български
 Français
 Tiếng Việt
 中文
中文 বাংলা
বাংলা हिन्दी
 Čeština
 Українська
 Română

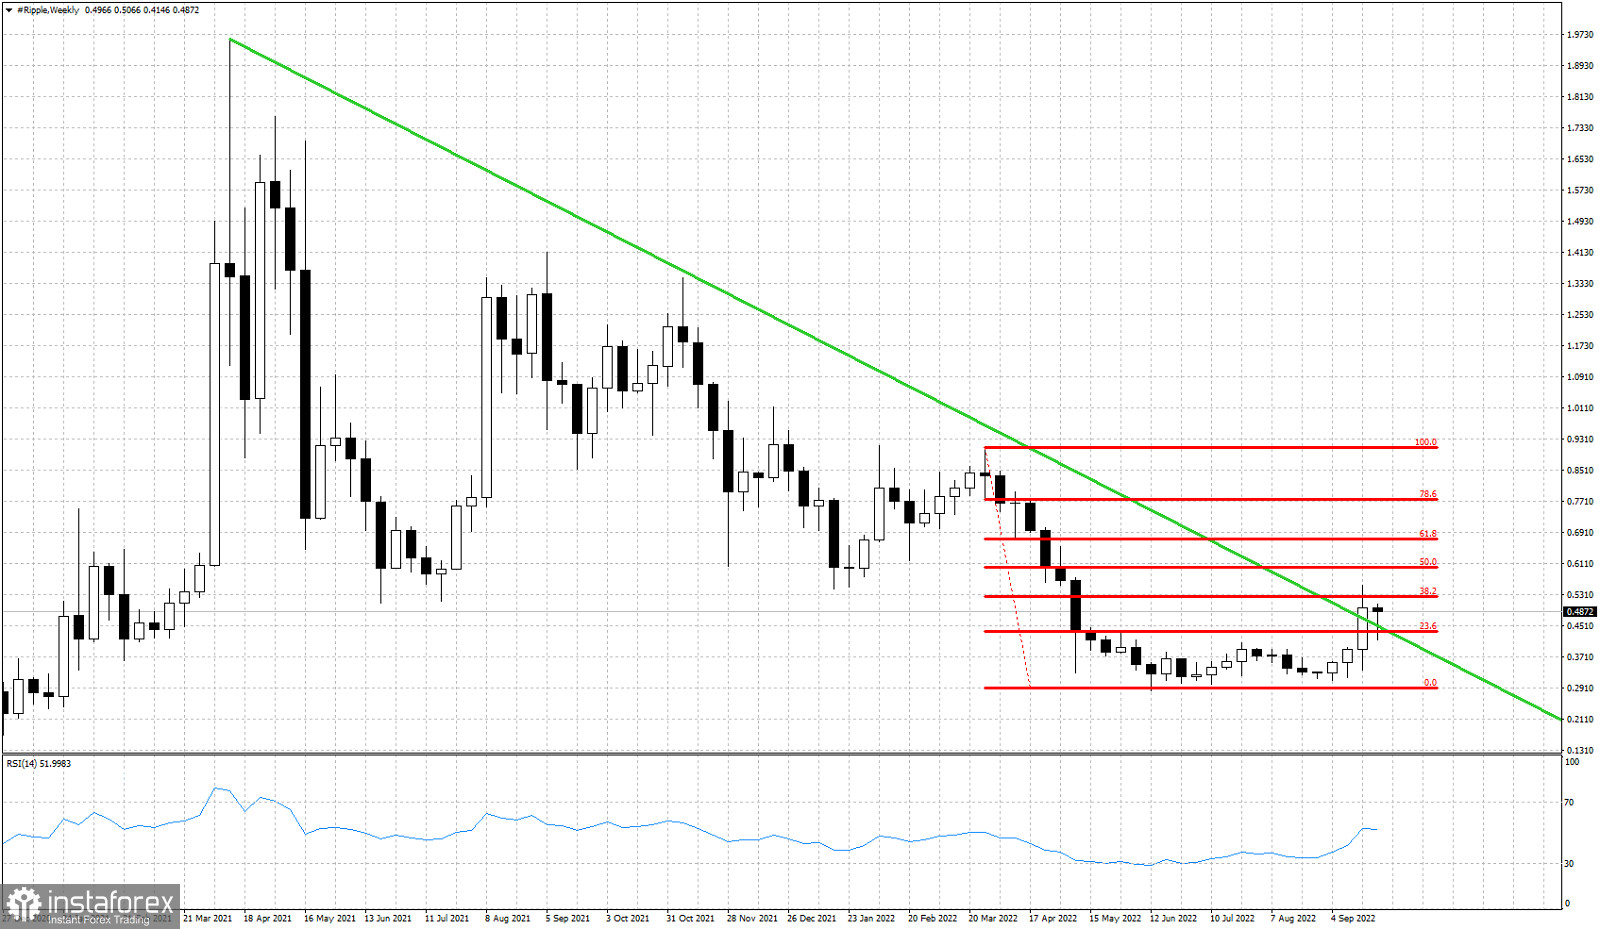
Green line - resistance trend line
Red lines- Fibonacci retracement levels
XRPUSD recently made a strong upward bounce from $0.33 to $0.55. Price has broken above the green downward sloping resistance trend line coming from the 2021 high. Price has so far retraced 38% of the decline from $0.9094. After last week's high at $0.55, price pulled back towards $0.41 and so far a higher low has been formed. Staying above the green trend line resistance is key for the medium-term trend. Forming higher lows and staying above the green trend line is key for the start of a new upward trend. Next upside target is at the 61.8% Fibonacci retracement at $0.67. Holding above $0.40 is critical. However there are still some possibilities that this entire upward move is just another counter trend bounce. This bearish scenario has not been cancelled yet.