 English
  Русский
 Bahasa Indonesia
 Bahasa Malay
 ไทย
ไทย Español
 Deutsch
 Български
 Français
 Tiếng Việt
 中文
中文 বাংলা
বাংলা हिन्दी
 Čeština
 Українська
 Română

Bitcoin continues to move sideways in the short term but the price action signaled potential upside pressure. It stands at the 19,451 level right below the 19,666 historical level. The current sideways movement may signal a potential upside breakout.
BTC/USD could still come back down to test and retest the near-term downside obstacles before trying to develop a new leg higher. The cryptocurrency changed little in the short term. In the last 24 hours, BTC/USD is down by 0.16%.
BTC/USD Confluence Area!
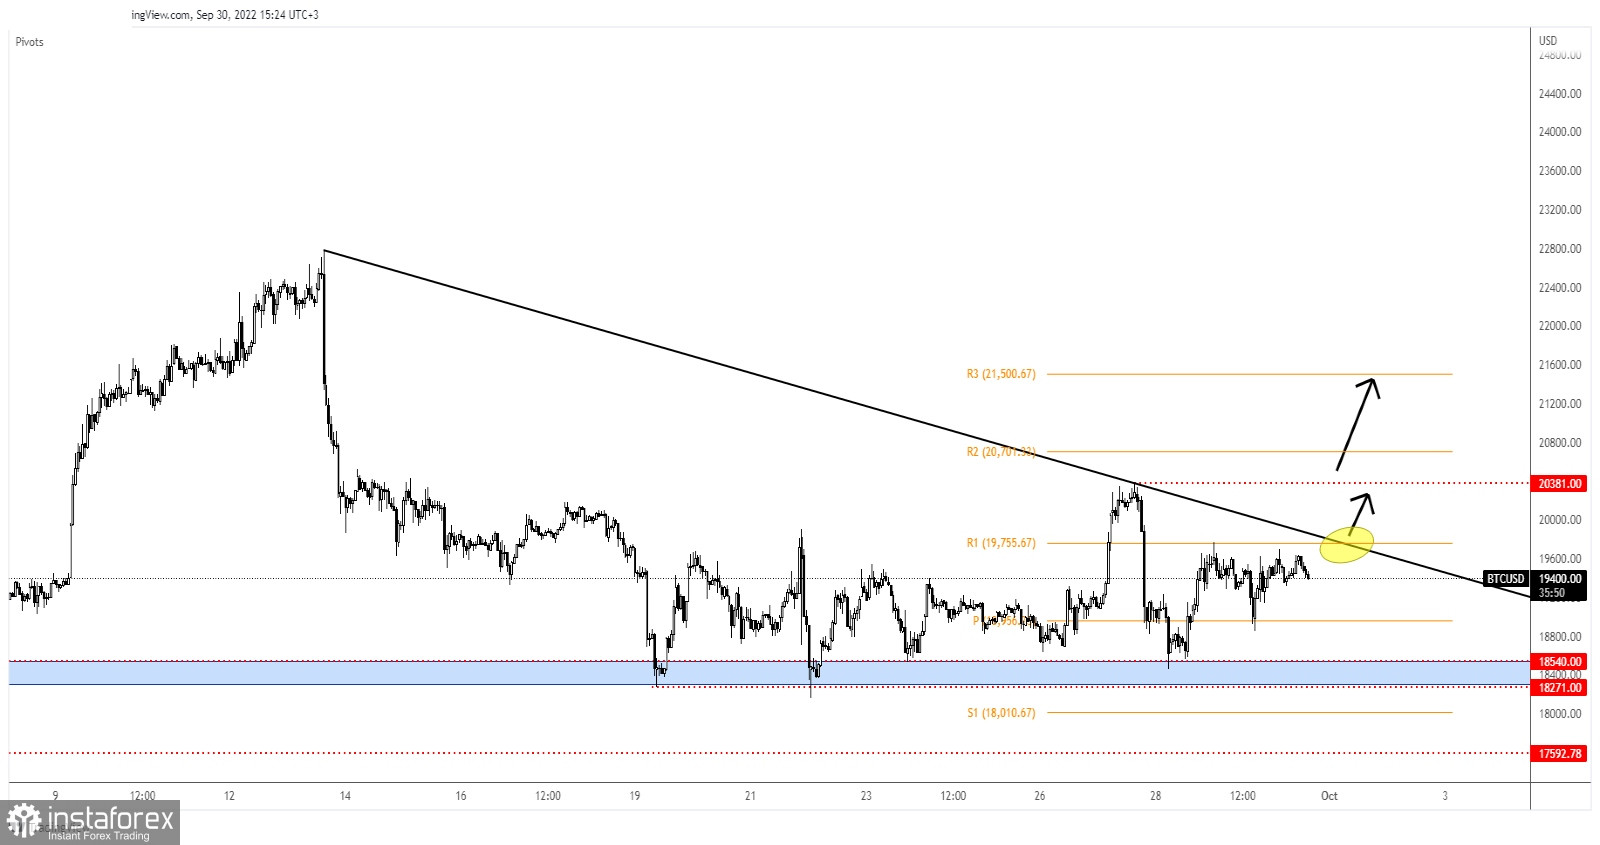
As you can see on the H1 chart, the price developed a potential triangle pattern. Staying near the downtrend line may signal an imminent upside breakout. Still, personally, I would like the rate to come back to test and retest the weekly pivot point of 19,956 before jumping higher.
In the short term, it could resume its range. False breakouts through the downtrend line could announce a new sell-off.
BTC/USD Forecast!
A valid breakout through the confluence area formed at the intersection between the downtrend line with the R1 (19,755) may signal a new leg higher. Personally, I will look for longs if the rate jumps and closes above the 20,381 former high.